Get 40% Off
🚨 Volatile Markets? Find Hidden Gems for Serious OutperformanceFind Stocks Now

Nasdaq looks different 15 years after its peak: then and now

Published 03/10/2015, 03:53 PM
Updated 03/10/2015, 04:00 PM
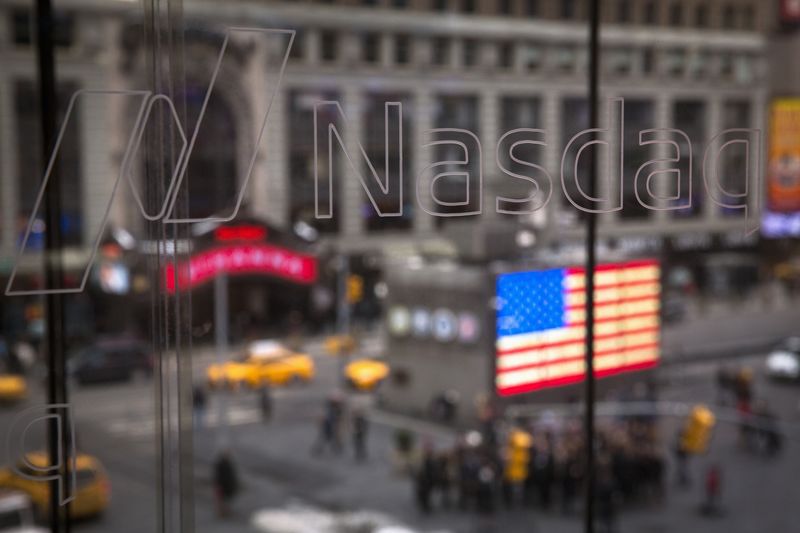
© Reuters. The Nasdaq logo is etched into glass at the headquarters for the Nasdaq in New York

(Reuters) - Happy anniversary, Nasdaq. It has been 15 years since the dot.com bubble peaked on March 10, 2000, and the Nasdaq composite index (IXIC) hit its lifetime intraday high of 5,132. Back then many of us were watching reality TV shows like "Survivor" and bidding up stocks of companies that had no earnings.

The index has not reached those heights since, though it briefly surpassed the 5,000 mark on March 2. It has since retreated.

These days, we are less focused on reality shows and more focused on reality - keeping tabs on dividends and price-earnings ratios, for example.

A lot has changed - Apple Inc (O:AAPL) wasn't even on the radar then. Now it's the most highly valued U.S. public company.

Here's a look at the Nasdaq, then and now.

Nasdaq value March 2015 March 2000

$8.01 trillion $6.6 trillion

Nasdaq P/E March 2015 March 2000

ratio

20.75 189.7

No. of March 2015 1999

companies

trading on

Nasdaq

2,565 4,715

Top 10 March 10, 2015 March 10, 2000

Components by

market cap

Apple $724.6 Microsoft (NASDAQ:MSFT)

bln $525.4 bln

Google (NASDAQ:GOOGL) $382.3 Cisco $466.4

bln bln

Microsoft Intel $401.3

$347.4 bln bln

Facebook $218.7 Oracle $232.4

bln bln

Amazon (NASDAQ:AMZN) $171.9 Sun Micro.

bln $164.5 bln

Intel $151.3 Dell $131.5 bln

bln

Gilead $147.8 Qualcomm (NASDAQ:QCOM) $96.4

bln bln

3rd party Ad. Not an offer or recommendation by Investing.com. See disclosure here or remove ads .

Cisco $147.2 Yahoo (NASDAQ:YHOO) $93.7 bln

bln

Comcast (NASDAQ:CMCSA) $125.8 Applied

bln Materials

$74.6 bln

Qualcomm $119.3 JDS Uniphase

bln $68.9 bln

No of stocks March 10, 2015 March 10, 2000

trading at $100

or higher

73 210

No of Nasdaq 2014 1999

IPOs in

previous year

189 397

Biggest Nasdaq 2014 1999

IPO

JD.com Inc Charter Comms.

$2.05bln $3.7 bln

Percentage of March 9, 2015 2000

Nasdaq cos in

tech industry

43 pct 64.9 pct

Dividend 2014 2000

payouts by

Nasdaq cos

$77.98 bln $14.14 bln

Best Picture 2015 2000

Oscar winner

Birdman American Beauty

Top rated TV March 2-8 2015 1999-2000

shows

The Big Bang Survivor

Theory

No 1 song: Week of March March 4 - March

Billboard Top 14 2015 11, 2000

100

"Uptown Funk" "Amazed" by

by Mark Ronson Lonestar

Data from Nasdaq, Reuters data, Nielsen, Billboard
Latest comments

Risk Disclosure: Trading in financial instruments and/or cryptocurrencies involves high risks including the risk of losing some, or all, of your investment amount, and may not be suitable for all investors. Prices of cryptocurrencies are extremely volatile and may be affected by external factors such as financial, regulatory or political events. Trading on margin increases the financial risks.
Before deciding to trade in financial instrument or cryptocurrencies you should be fully informed of the risks and costs associated with trading the financial markets, carefully consider your investment objectives, level of experience, and risk appetite, and seek professional advice where needed.
Fusion Media would like to remind you that the data contained in this website is not necessarily real-time nor accurate. The data and prices on the website are not necessarily provided by any market or exchange, but may be provided by market makers, and so prices may not be accurate and may differ from the actual price at any given market, meaning prices are indicative and not appropriate for trading purposes. Fusion Media and any provider of the data contained in this website will not accept liability for any loss or damage as a result of your trading, or your reliance on the information contained within this website.
It is prohibited to use, store, reproduce, display, modify, transmit or distribute the data contained in this website without the explicit prior written permission of Fusion Media and/or the data provider. All intellectual property rights are reserved by the providers and/or the exchange providing the data contained in this website.
Fusion Media may be compensated by the advertisers that appear on the website, based on your interaction with the advertisements or advertisers.
© 2007-2024 - Fusion Media Limited. All Rights Reserved.