By Ryan Vlastelica
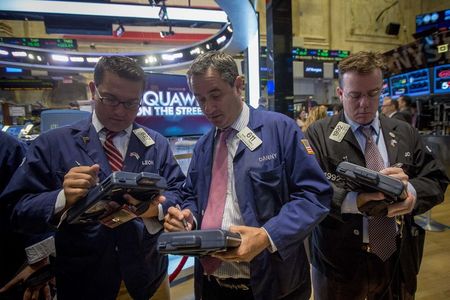
NEW YORK (Reuters) - U.S. stocks fell on Tuesday, with consumer staples leading the S&P 500 down to its third straight daily loss, as investors grew concerned about the pace of global economic growth.
The day's losses were broad, with all ten primary S&P sectors down. Consumer staples <.SPLRCS> were the weakest on the day, off 0.9 percent, while industrials <.SPLRCI> lost 0.8 percent.
Wall Street's losses tracked Europe's (FTEU3) 1.3 percent slump after data showed a contraction in French business activity and slower growth in German manufacturing this month.
The European data "is a little concerning," said David Lebovitz, global market strategist for J.P. Morgan Funds in New York. "We didn't expect things to improve there forever and always, but we are seeing a bit of a slowdown, which is weighing a bit."
Unrest abroad added an element of caution to the market after the launch of U.S. air strikes in Syria against Islamic State fighters. The tension lifted crude oil prices
"It will be important to see how this issue plays out, but so far oil has been pretty well behaved," Lebovitz said. "So long as it remains under $100, markets should be able to take this in stride. Past that level, it will become a drag on consumption."
The Dow Jones industrial average (DJI) fell 116.81 points, or 0.68 percent, to 17,055.87, the S&P 500 (SPX) lost 11.52 points, or 0.58 percent, to 1,982.77 and the Nasdaq Composite (IXIC) dropped 19.00 points, or 0.42 percent, to 4,508.69.
The S&P 500 fell for a third consecutive session and closed below its 14-day moving average for a second straight day, a sign of weak near-term momentum.
S&P 500 e-mini futures
The Russell 2000 <.TOY> fell 0.9 percent during the normal session, and the small cap index's 50-day moving average fell slightly under its 200-day moving average, a condition known as a "death cross," which many investors view as indicating a coming bear market.
CarMax Inc (N:KMX) was the biggest S&P 500 decliner on the day, off 9.5 percent to $47.80 after earnings missed expectations and same-store sales fell from the prior year.
CF Industries (N:CF) jumped 5.3 percent to $269.37 as the benchmark index's biggest gainer. The fertilizer company is in talks about a merger of equals with Norway's Yara (OL:YAR).
Bed Bath & Beyond (O:BBBY) rose 6.6 percent to $66.85 in after-hours trading after the company reported its second-quarter results, which included a 3.4 percent rise in same-store sales.

More than two-thirds of stocks traded on both the New York Stock Exchange and the Nasdaq closed lower on the day. About 6.21 billion shares traded on all U.S. platforms, according to BATS exchange data, compared with the month-to-date average of about 6 billion.
(Editing by Nick Zieminski. Editing by Andre Grenon)
