


Sign up to create alerts for Instruments,
Economic Events and content by followed authors
Free Sign Up Already have an account? Sign In
Please try another search
Forum & video on ES
Fri 16 Oct 2009
Barrometrics Views: S&P 2009-10-16
A little pushed for time today; so, I am duplicating below the Forum comment found at
“A small change to how I have been writing this. I’ll be attaching the charts with the comments as I review them. This will provide you with the background to my thoughts. This leaves me more space to articulate my conclusions here.
The charts contain only one bearish element: we see from the Normalised Chart (Chart 1), that yesterday the S&P had normal volume and below normal range. This is normally bearish given the S&P had a higher high and higher low.
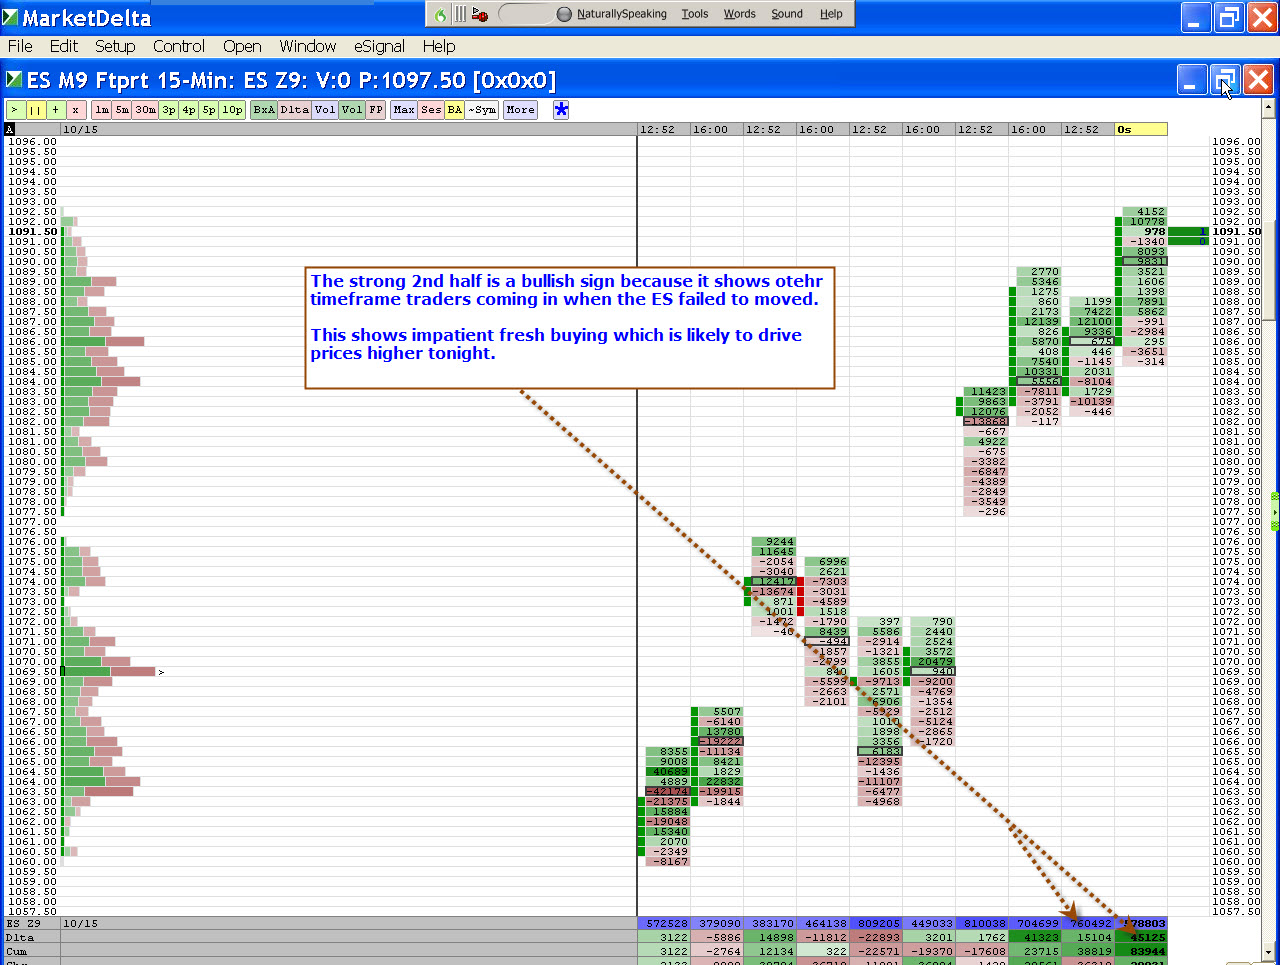
HOWEVER, the Combined Market Profile (Chart 2) chart shows that last night was part of development (correction over time and price). This being the case, the low range/volume ratio is not as bearish as it would have been if last night’s price was a directional move.
The new directional move up needs to begin soon (the Combined Profile suggests tonight would be optimum). A delay in the directional move would normally bring the sellers; and given the R0 as a middle structure (see chart 3), a break below 1019.5 (basis Dec) would suggest that the 13-w is now correcting. The first indication this is happening is acceptance below 1075. (see below).
SCENARIOS FOR OCT 16
Looking either for a open-gap or a strong move up (at least 8 point range, preferably 12 or more) by 11:00 am EST. This sets the scene for a strong directional move next week.
A strong move down, especially one that accepts below 1080 (basis Dec), places the 1075 to 1077 (basis Dec) under threat. Acceptance below these levels would be the first signs that the ES 18-d trend has topped out and we are beginning a 13-w correction (18-d downtrend).
Traditionally, the ‘equity options expiry’ trading session means a volatile session but that has been less true in recent history. I mention this so that you are forewarned.
OH, let me answer this now, because I am envitably asked: what is the Forum service? It’s a weekly video and daily commentary on the ES. The figure below shows how to register.
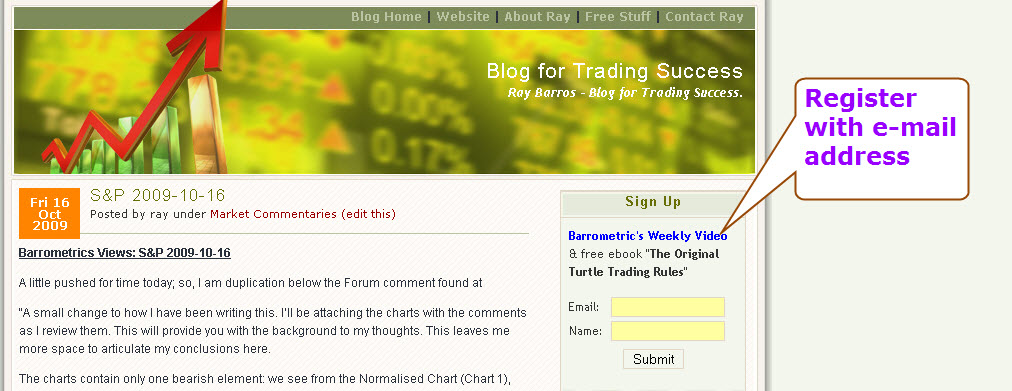
FIGURE FORUM REGISTRATION
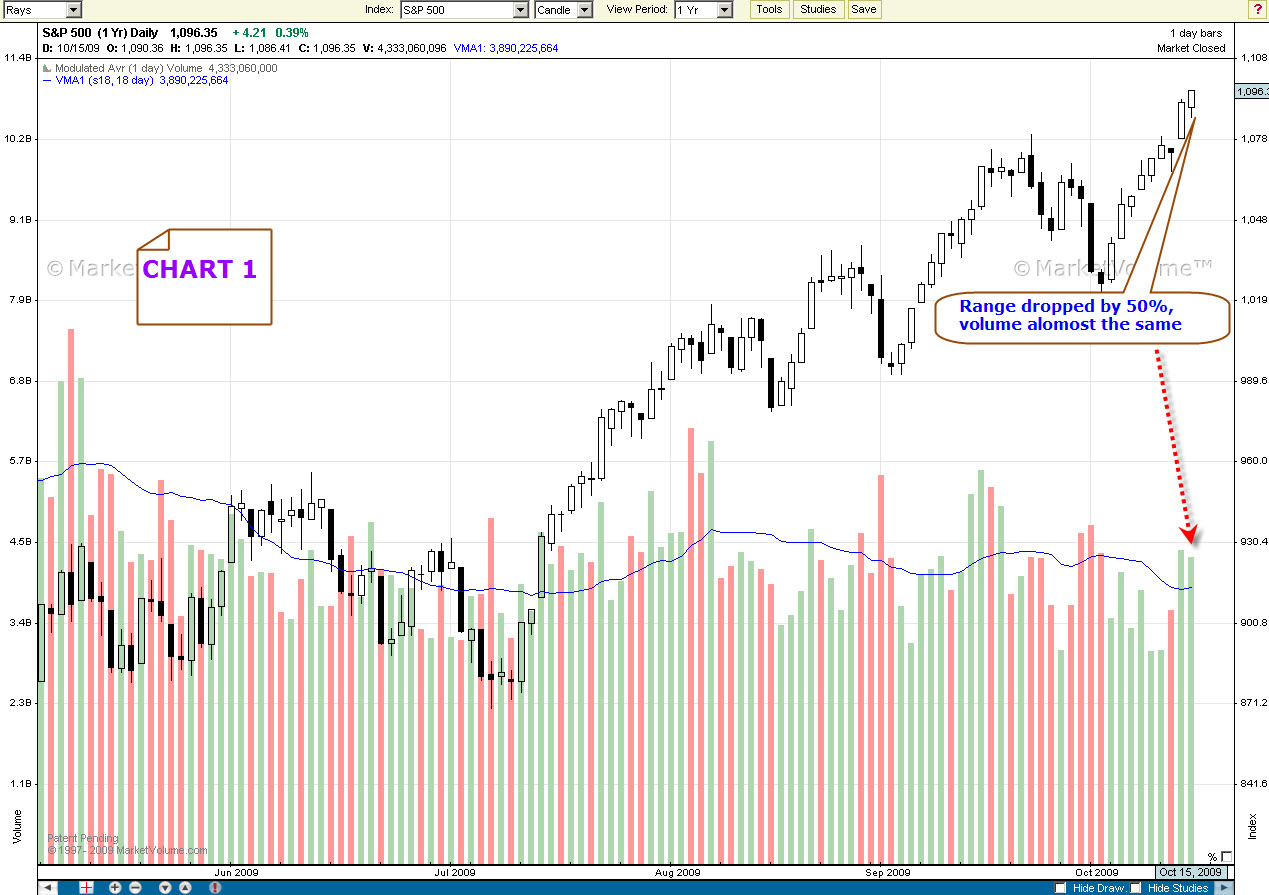
Chart 1 Normalised Volume
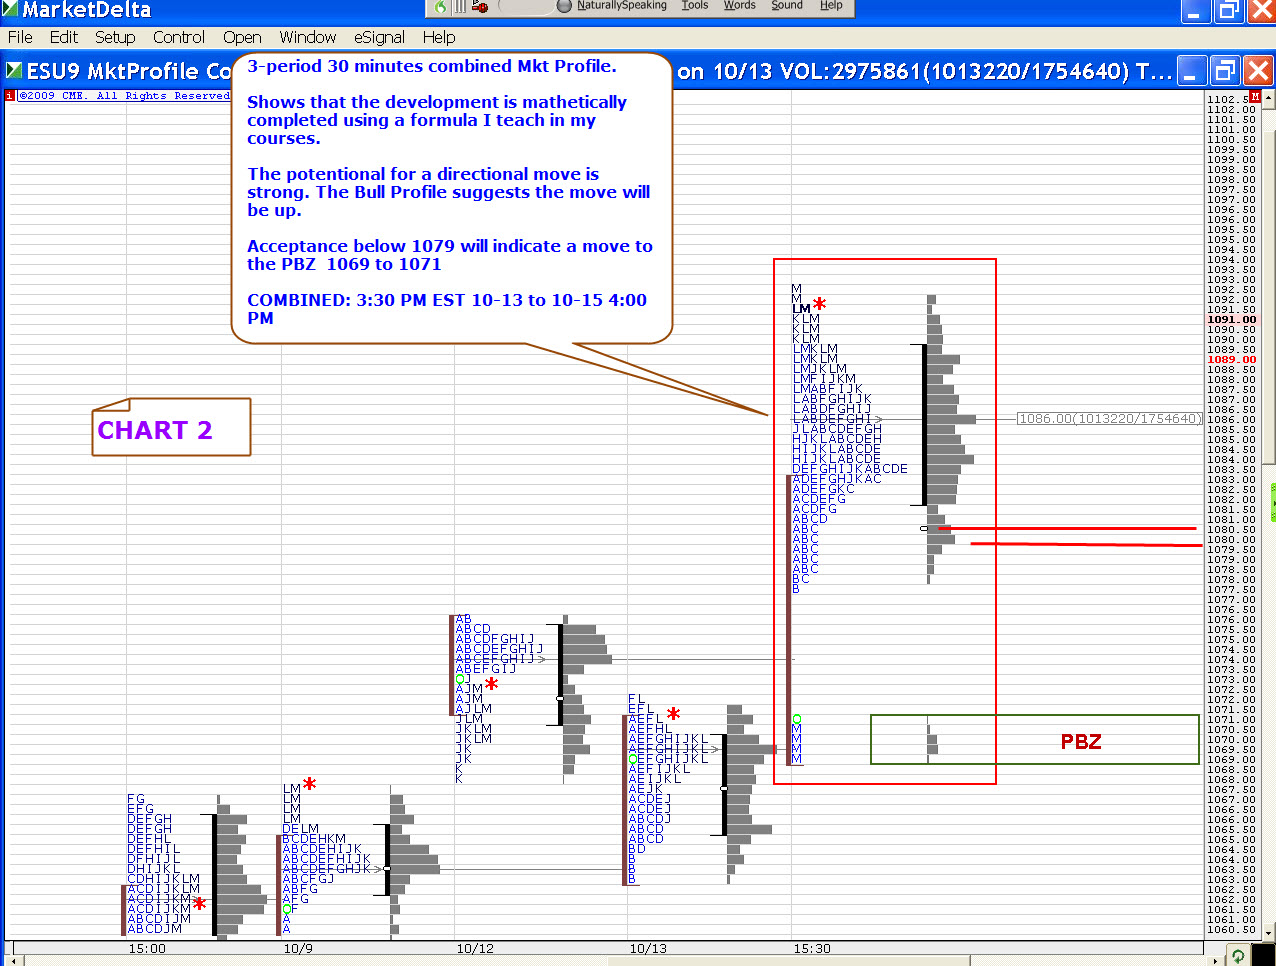
Chart 2 Combined Market Profile
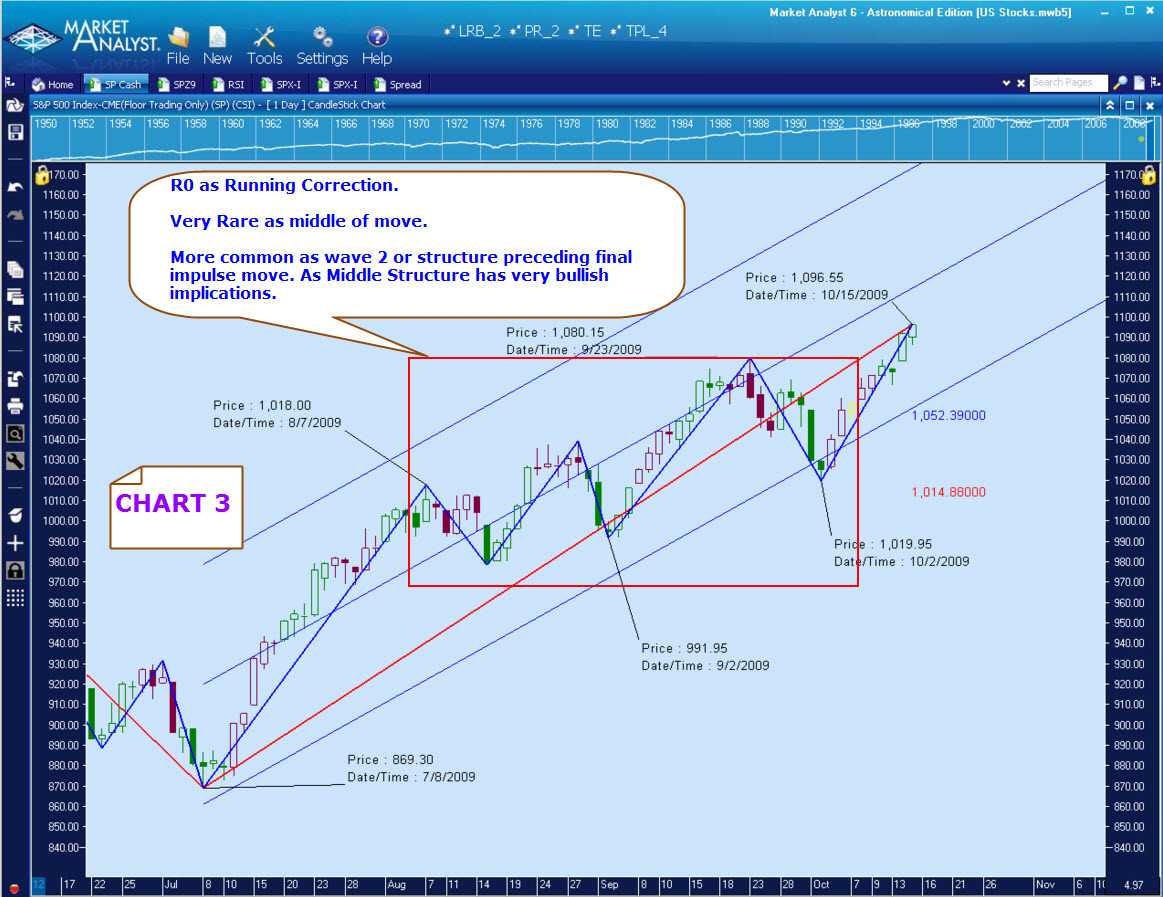
Chart 3 Barros Swing R0
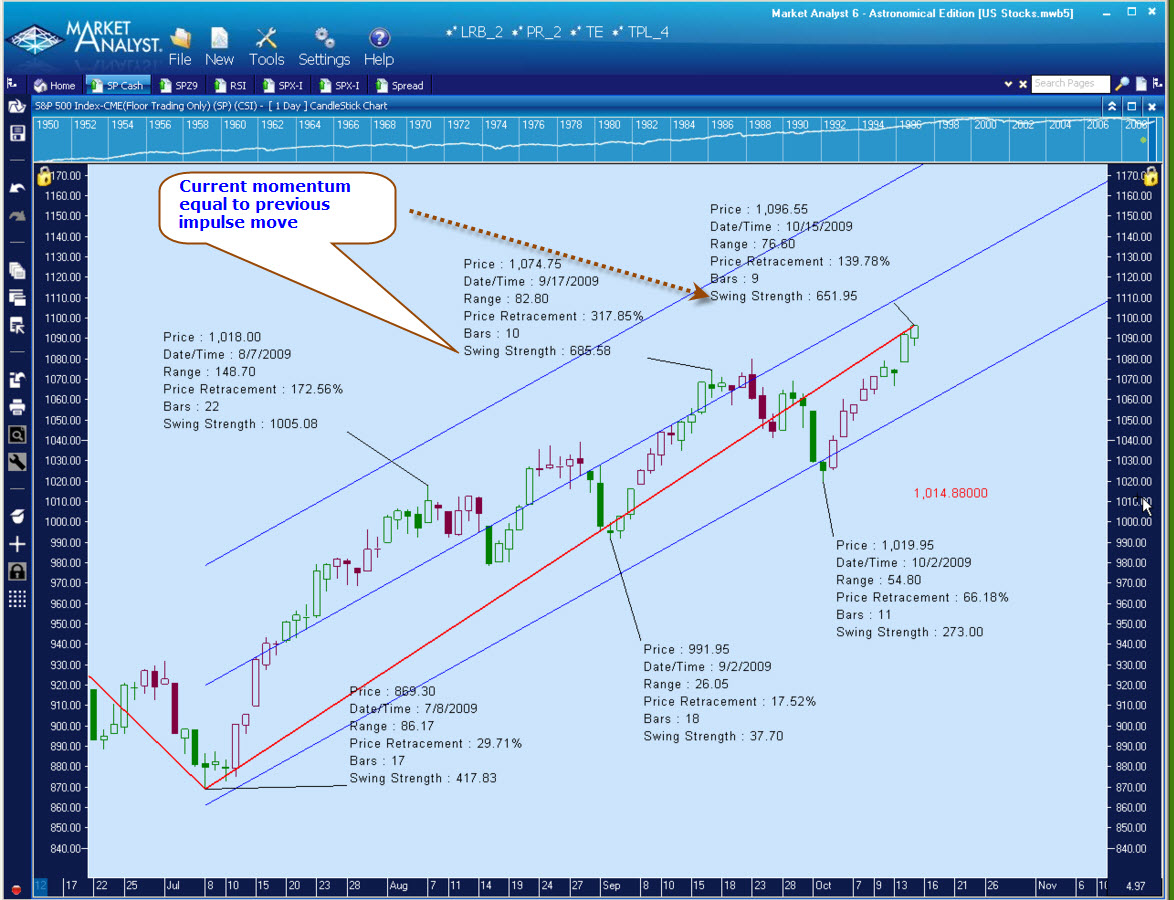
Chart 4 Momentum Swing Strength
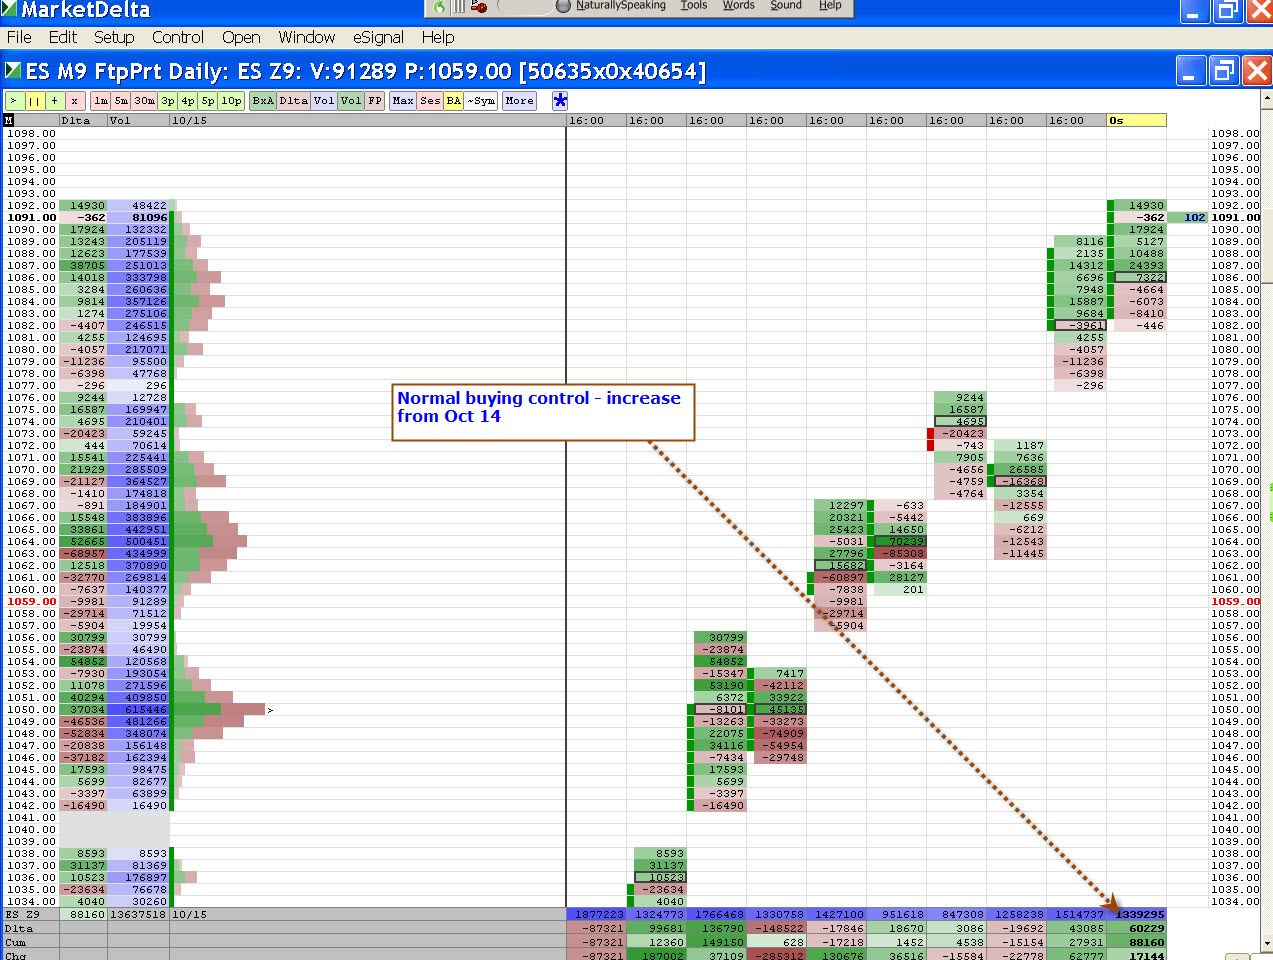
Chart 5 Market Delta EOD
Ray Barros