


Sign up to create alerts for Instruments,
Economic Events and content by followed authors
Free Sign Up Already have an account? Sign In
Please try another search
| Symbol | Exchange | Currency | ||
|---|---|---|---|---|
| CL | Derived | USD | Real-time | |
| WTCLc2 | ICE | USD | Delayed | |
| WTCLc5 | ICE | USD | Delayed | |
| WTCLc4 | ICE | USD | Delayed | |
| CLc7 | CME | USD | Delayed | |
| CLc6 | CME | USD | Delayed | |
| CLc5 | CME | USD | Delayed | |
| CLc4 | CME | USD | Delayed | |
| WTCLc3 | ICE | USD | Delayed | |
| MCGBc1 | MCX | INR | Real-time | |
| WTCLc1 | ICE | USD | Delayed | |
| MCGBc3 | MCX | INR | Real-time | |
| MCGBc2 | MCX | INR | Real-time | |
| CLc3 | CME | USD | Delayed | |
| CLc2 | CME | USD | Delayed | |
| CLc1 | CME | USD | Delayed | |
| JCOc1 | TOCOM | JPY | Delayed |
| Month | Last | Chg. | Open | High | Low | Volume | Time | Chart | |
|---|---|---|---|---|---|---|---|---|---|
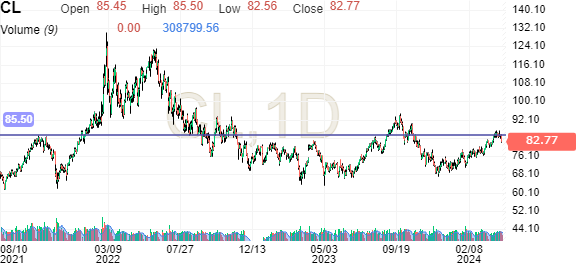
| Cash | 85.35s | -0.07 | 85.35 | 85.35 | 85.35 | 0 | 04/16/24 | Q / C / O | |
| May 24 | 82.79 | -2.57 | 85.36 | 85.51 | 82.55 | 230710 | 14:30 | Q / C / O | |
| Jun 24 | 82.26 | -2.57 | 84.82 | 84.97 | 82.01 | 352026 | 14:30 | Q / C / O | |
| Jul 24 | 81.72 | -2.50 | 84.23 | 84.37 | 81.50 | 138554 | 14:29 | Q / C / O | |
| Aug 24 | 81.15 | -2.36 | 83.52 | 83.55 | 80.91 | 62937 | 14:29 | Q / C / O | |
| Sep 24 | 80.44 | -2.29 | 82.77 | 82.87 | 80.22 | 67071 | 14:29 | Q / C / O | |
| Oct 24 | 79.72 | -2.20 | 81.97 | 82.08 | 79.56 | 24989 | 14:22 | Q / C / O | |
| Nov 24 | 79.06 | -2.09 | 81.31 | 81.31 | 78.87 | 13140 | 14:17 | Q / C / O | |
| Dec 24 | 78.43 | -1.97 | 80.48 | 80.60 | 78.21 | 85286 | 14:29 | Q / C / O | |
| Jan 25 | 77.64 | -2.03 | 79.44 | 79.64 | 77.62 | 6792 | 14:02 | Q / C / O | |
| Feb 25 | 77.06 | -1.92 | 78.84 | 78.95 | 77.06 | 3450 | 14:06 | Q / C / O | |
| Mar 25 | 76.58 | -1.77 | 78.55 | 78.55 | 76.42 | 10805 | 13:49 | Q / C / O | |
| Apr 25 | 76.04 | -1.72 | 77.58 | 77.58 | 76.00 | 749 | 13:58 | Q / C / O | |
| May 25 | 75.99 | -1.24 | 75.80 | 75.99 | 75.53 | 1326 | 13:30 | Q / C / O | |
| Jun 25 | 75.25 | -1.49 | 76.80 | 76.93 | 74.96 | 19049 | 14:28 | Q / C / O | |
| Jul 25 | 74.63 | -1.60 | 0.00 | 74.63 | 74.63 | 712 | 14:29 | Q / C / O | |
| Aug 25 | 74.19 | -1.56 | 0.00 | 74.19 | 74.19 | 202 | 14:30 | Q / C / O | |
| Sep 25 | 75.08 | -0.22 | 75.08 | 75.08 | 73.80 | 1217 | 10:14 | Q / C / O | |
| Oct 25 | 74.69 | -0.20 | 74.69 | 74.69 | 73.44 | 221 | 10:14 | Q / C / O | |
| Nov 25 | 73.11 | -1.41 | 0.00 | 73.11 | 73.11 | 348 | 14:28 | Q / C / O | |
| Dec 25 | 72.93 | -1.25 | 74.18 | 74.36 | 72.66 | 32337 | 14:30 | Q / C / O | |
| Jan 26 | 72.45 | -1.33 | 0.00 | 72.45 | 72.45 | 14 | 14:30 | Q / C / O | |
| Feb 26 | 72.10 | -1.28 | 0.00 | 72.10 | 72.10 | 87 | 14:29 | Q / C / O | |
| Mar 26 | 71.75 | -1.27 | 0.00 | 71.75 | 71.75 | 519 | 14:30 | Q / C / O | |
| Apr 26 | 71.43 | -1.25 | 0.00 | 71.43 | 71.43 | 77 | 14:26 | Q / C / O | |
| May 26 | 71.16 | -1.20 | 0.00 | 71.16 | 71.16 | 0 | 14:29 | Q / C / O | |
| Jun 26 | 70.87 | -1.18 | 72.01 | 72.14 | 70.78 | 5249 | 13:29 | Q / C / O | |
| Jul 26 | 70.55 | -1.16 | 0.00 | 70.55 | 70.55 | 15 | 14:29 | Q / C / O | |
| Aug 26 | 70.24 | -1.14 | 0.00 | 70.24 | 70.24 | 0 | 14:26 | Q / C / O | |
| Sep 26 | 69.96 | -1.12 | 0.00 | 69.96 | 69.96 | 44 | 14:30 | Q / C / O | |
| Oct 26 | 69.70 | -1.10 | 0.00 | 69.70 | 69.70 | 0 | 14:26 | Q / C / O | |
| Nov 26 | 69.65 | -0.90 | 69.65 | 69.65 | 69.48 | 16 | 12:46 | Q / C / O | |
| Dec 26 | 69.33 | -0.98 | 70.29 | 70.45 | 69.22 | 5049 | 13:53 | Q / C / O | |
| Jan 27 | 69.04 | -0.99 | 0.00 | 69.04 | 69.04 | 4 | 13:56 | Q / C / O | |
| Feb 27 | 68.76 | -0.98 | 0.00 | 68.76 | 68.76 | 4 | 13:56 | Q / C / O | |
| Mar 27 | 68.52 | -0.96 | 0.00 | 68.52 | 68.52 | 12 | 13:56 | Q / C / O | |
| Apr 27 | 68.31 | -0.93 | 0.00 | 68.31 | 68.31 | 0 | 13:56 | Q / C / O | |
| May 27 | 68.10 | -0.92 | 0.00 | 68.10 | 68.10 | 0 | 13:56 | Q / C / O | |
| Jun 27 | 67.91 | -0.90 | 0.00 | 67.91 | 67.91 | 117 | 14:29 | Q / C / O | |
| Jul 27 | 67.67 | -0.89 | 0.00 | 67.67 | 67.67 | 0 | 13:56 | Q / C / O | |
| Aug 27 | 67.46 | -0.90 | 0.00 | 67.46 | 67.46 | 0 | 13:56 | Q / C / O | |
| Sep 27 | 67.28 | -0.89 | 0.00 | 67.28 | 67.28 | 25 | 13:56 | Q / C / O | |
| Oct 27 | 67.13 | -0.87 | 0.00 | 67.13 | 67.13 | 0 | 13:56 | Q / C / O | |
| Nov 27 | 66.96 | -0.82 | 0.00 | 66.96 | 66.96 | 0 | 13:56 | Q / C / O | |
| Dec 27 | 67.51 | -0.13 | 67.79 | 67.79 | 66.84 | 793 | 10:43 | Q / C / O | |
| Jan 28 | 66.65 | -0.78 | 0.00 | 66.65 | 66.65 | 0 | 13:56 | Q / C / O | |
| Feb 28 | 66.38 | -0.78 | 0.00 | 66.38 | 66.38 | 0 | 13:56 | Q / C / O | |
| Mar 28 | 66.23 | -0.77 | 0.00 | 66.23 | 66.23 | 0 | 13:56 | Q / C / O | |
| Apr 28 | 66.09 | -0.76 | 0.00 | 66.09 | 66.09 | 0 | 13:56 | Q / C / O | |
| May 28 | 65.98 | -0.75 | 0.00 | 65.98 | 65.98 | 0 | 13:56 | Q / C / O | |
| Jun 28 | 65.86 | -0.74 | 0.00 | 65.86 | 65.86 | 0 | 13:56 | Q / C / O | |
| Jul 28 | 65.70 | -0.73 | 0.00 | 65.70 | 65.70 | 0 | 13:56 | Q / C / O | |
| Aug 28 | 65.50 | -0.73 | 0.00 | 65.50 | 65.50 | 0 | 13:56 | Q / C / O | |
| Sep 28 | 65.42 | -0.72 | 0.00 | 65.42 | 65.42 | 0 | 13:56 | Q / C / O | |
| Oct 28 | 65.33 | -0.71 | 0.00 | 65.33 | 65.33 | 0 | 13:56 | Q / C / O | |
| Nov 28 | 65.24 | -0.71 | 0.00 | 65.24 | 65.24 | 0 | 13:56 | Q / C / O | |
| Dec 28 | 65.85 | +0.02 | 65.95 | 65.95 | 65.13 | 104 | 10:40 | Q / C / O | |
| Jan 29 | 64.94 | -0.70 | 0.00 | 64.94 | 64.94 | 0 | 13:56 | Q / C / O | |
| Feb 29 | 64.83 | -0.69 | 0.00 | 64.83 | 64.83 | 0 | 13:56 | Q / C / O | |
| Mar 29 | 64.72 | -0.69 | 0.00 | 64.72 | 64.72 | 0 | 13:56 | Q / C / O | |
| Apr 29 | 64.60 | -0.68 | 0.00 | 64.60 | 64.60 | 0 | 13:56 | Q / C / O | |
| May 29 | 64.52 | -0.68 | 0.00 | 64.52 | 64.52 | 0 | 13:56 | Q / C / O | |
| Jun 29 | 64.45 | -0.68 | 0.00 | 64.45 | 64.45 | 0 | 13:56 | Q / C / O | |
| Jul 29 | 64.31 | -0.67 | 0.00 | 64.31 | 64.31 | 0 | 13:56 | Q / C / O | |
| Aug 29 | 64.22 | -0.67 | 0.00 | 64.22 | 64.22 | 0 | 13:56 | Q / C / O | |
| Sep 29 | 64.15 | -0.66 | 0.00 | 64.15 | 64.15 | 0 | 13:56 | Q / C / O | |
| Oct 29 | 64.10 | -0.66 | 0.00 | 64.10 | 64.10 | 0 | 13:56 | Q / C / O | |
| Nov 29 | 64.07 | -0.65 | 0.00 | 64.07 | 64.07 | 0 | 13:56 | Q / C / O | |
| Dec 29 | 64.03 | -0.65 | 0.00 | 64.03 | 64.03 | 2 | 14:29 | Q / C / O | |
| Jan 30 | 64.00 | -0.65 | 0.00 | 64.00 | 64.00 | 0 | 13:56 | Q / C / O | |
| Feb 30 | 63.90 | -0.65 | 0.00 | 63.90 | 63.90 | 0 | 13:56 | Q / C / O | |
| Mar 30 | 63.81 | -0.65 | 0.00 | 63.81 | 63.81 | 0 | 13:56 | Q / C / O | |
| Apr 30 | 63.70 | -0.65 | 0.00 | 63.70 | 63.70 | 0 | 13:56 | Q / C / O | |
| May 30 | 63.68 | -0.65 | 0.00 | 63.68 | 63.68 | 0 | 13:56 | Q / C / O | |
| Jun 30 | 63.61 | -0.65 | 0.00 | 63.61 | 63.61 | 0 | 13:56 | Q / C / O | |
| Jul 30 | 63.63 | -0.65 | 0.00 | 63.63 | 63.63 | 0 | 13:56 | Q / C / O | |
| Aug 30 | 63.58 | -0.65 | 0.00 | 63.58 | 63.58 | 0 | 13:56 | Q / C / O | |
| Sep 30 | 63.58 | -0.65 | 0.00 | 63.58 | 63.58 | 0 | 13:56 | Q / C / O | |
| Oct 30 | 63.53 | -0.65 | 0.00 | 63.53 | 63.53 | 0 | 13:56 | Q / C / O | |
| Nov 30 | 63.52 | -0.65 | 0.00 | 63.52 | 63.52 | 0 | 13:56 | Q / C / O | |
| Dec 30 | 64.50 | +0.44 | 64.50 | 64.50 | 63.41 | 7 | 10:39 | Q / C / O | |
| Jan 31 | 63.42 | -0.65 | 0.00 | 63.42 | 63.42 | 0 | 13:56 | Q / C / O | |
| Feb 31 | 63.36 | -0.65 | 0.00 | 63.36 | 63.36 | 0 | 13:56 | Q / C / O | |
| Mar 31 | 63.38 | -0.65 | 0.00 | 63.38 | 63.38 | 0 | 13:56 | Q / C / O | |
| Apr 31 | 63.38 | -0.65 | 0.00 | 63.38 | 63.38 | 0 | 13:56 | Q / C / O | |
| May 31 | 63.34 | -0.65 | 0.00 | 63.34 | 63.34 | 0 | 13:56 | Q / C / O | |
| Jun 31 | 63.18 | -0.65 | 0.00 | 63.18 | 63.18 | 0 | 13:56 | Q / C / O | |
| Jul 31 | 63.35 | -0.65 | 0.00 | 63.35 | 63.35 | 0 | 13:56 | Q / C / O | |
| Aug 31 | 63.36 | -0.65 | 0.00 | 63.36 | 63.36 | 0 | 13:56 | Q / C / O | |
| Sep 31 | 63.30 | -0.65 | 0.00 | 63.30 | 63.30 | 0 | 13:56 | Q / C / O | |
| Oct 31 | 63.32 | -0.65 | 0.00 | 63.32 | 63.32 | 0 | 13:56 | Q / C / O | |
| Nov 31 | 63.33 | -0.65 | 0.00 | 63.33 | 63.33 | 0 | 13:56 | Q / C / O | |
| Dec 31 | 63.21 | -0.65 | 0.00 | 63.21 | 63.21 | 0 | 13:56 | Q / C / O | |
| Jan 32 | 63.19 | -0.65 | 0.00 | 63.19 | 63.19 | 0 | 13:56 | Q / C / O | |
| Feb 32 | 63.17 | -0.65 | 0.00 | 63.17 | 63.17 | 0 | 13:56 | Q / C / O | |
| Mar 32 | 63.16 | -0.65 | 0.00 | 63.16 | 63.16 | 0 | 13:56 | Q / C / O | |
| Apr 32 | 63.16 | -0.65 | 0.00 | 63.16 | 63.16 | 0 | 13:56 | Q / C / O | |
| May 32 | 63.11 | -0.65 | 0.00 | 63.11 | 63.11 | 0 | 13:56 | Q / C / O | |
| Jun 32 | 63.06 | -0.65 | 0.00 | 63.06 | 63.06 | 0 | 13:56 | Q / C / O | |
| Jul 32 | 63.17 | -0.65 | 0.00 | 63.17 | 63.17 | 0 | 13:56 | Q / C / O | |
| Aug 32 | 63.20 | -0.65 | 0.00 | 63.20 | 63.20 | 0 | 13:56 | Q / C / O | |
| Sep 32 | 63.20 | -0.65 | 0.00 | 63.20 | 63.20 | 0 | 13:56 | Q / C / O | |
| Oct 32 | 63.16 | -0.65 | 0.00 | 63.16 | 63.16 | 0 | 13:56 | Q / C / O | |
| Nov 32 | 63.14 | -0.65 | 0.00 | 63.14 | 63.14 | 0 | 13:56 | Q / C / O | |
| Dec 32 | 63.11 | -0.65 | 0.00 | 63.11 | 63.11 | 0 | 13:56 | Q / C / O | |
| Jan 33 | 63.05 | -0.65 | 0.00 | 63.05 | 63.05 | 0 | 13:56 | Q / C / O | |
| Feb 33 | 63.04 | -0.65 | 0.00 | 63.04 | 63.04 | 0 | 13:56 | Q / C / O | |
| Mar 33 | 63.03 | -0.65 | 0.00 | 63.03 | 63.03 | 0 | 13:56 | Q / C / O | |
| Apr 33 | 63.02 | -0.65 | 0.00 | 63.02 | 63.02 | 0 | 13:56 | Q / C / O | |
| May 33 | 63.05 | -0.65 | 0.00 | 63.05 | 63.05 | 0 | 13:56 | Q / C / O | |
| Jun 33 | 63.05 | -0.65 | 0.00 | 63.05 | 63.05 | 0 | 13:56 | Q / C / O | |
| Jul 33 | 63.05 | -0.65 | 0.00 | 63.05 | 63.05 | 0 | 13:56 | Q / C / O | |
| Aug 33 | 63.09 | -0.65 | 0.00 | 63.09 | 63.09 | 0 | 13:56 | Q / C / O | |
| Sep 33 | 63.10 | -0.65 | 0.00 | 63.10 | 63.10 | 0 | 13:56 | Q / C / O | |
| Oct 33 | 63.13 | -0.65 | 0.00 | 63.13 | 63.13 | 0 | 13:56 | Q / C / O | |
| Nov 33 | 63.11 | -0.65 | 0.00 | 63.11 | 63.11 | 0 | 13:56 | Q / C / O | |
| Dec 33 | 63.10 | -0.65 | 0.00 | 63.10 | 63.10 | 0 | 13:56 | Q / C / O | |
| Jan 34 | 63.03 | -0.65 | 0.00 | 63.03 | 63.03 | 0 | 13:56 | Q / C / O | |
| Feb 34 | 63.05 | -0.65 | 0.00 | 63.05 | 63.05 | 0 | 13:56 | Q / C / O | |
| Mar 34 | 63.01 | -0.65 | 0.00 | 63.01 | 63.01 | 0 | 13:56 | Q / C / O | |
| Apr 34 | 63.00 | -0.65 | 0.00 | 63.00 | 63.00 | 0 | 13:56 | Q / C / O | |
| May 34 | 63.04 | -0.65 | 0.00 | 63.04 | 63.04 | 0 | 13:56 | Q / C / O | |
| Jun 34 | 63.02 | -0.65 | 0.00 | 63.02 | 63.02 | 0 | 13:56 | Q / C / O | |
| Jul 34 | 62.98 | -0.65 | 0.00 | 62.98 | 62.98 | 0 | 13:56 | Q / C / O | |
| Aug 34 | 62.99 | -0.65 | 0.00 | 62.99 | 62.99 | 0 | 13:56 | Q / C / O | |
| Sep 34 | 62.99 | -0.65 | 0.00 | 62.99 | 62.99 | 0 | 13:56 | Q / C / O | |
| Oct 34 | 63.02 | -0.65 | 0.00 | 63.02 | 63.02 | 0 | 13:56 | Q / C / O | |
| Nov 34 | 63.02 | -0.65 | 0.00 | 63.02 | 63.02 | 0 | 13:56 | Q / C / O | |
| Dec 34 | 63.10 | -0.65 | 0.00 | 63.10 | 63.10 | 0 | 13:56 | Q / C / O | |
| Jan 35 | 63.03 | -0.65 | 0.00 | 63.03 | 63.03 | 0 | 13:56 | Q / C / O | |
| Feb 35 | 62.97 | -0.65 | 0.00 | 62.97 | 62.97 | 0 | 13:56 | Q / C / O |
| © 2016 Market data provided and hosted by Barchart Market Data Solutions. Fundamental company data provided by Morningstar and Zacks Investment Research. Information is provided 'as-is' and solely for informational purposes, not for trading purposes or advice, and is delayed. To see all exchange delays and terms of use please see disclaimer. |

Are you sure you want to block %USER_NAME%?
By doing so, you and %USER_NAME% will not be able to see any of each other's Investing.com's posts.
%USER_NAME% was successfully added to your Block List
Since you’ve just unblocked this person, you must wait 48 hours before renewing the block.
I feel that this comment is:
Thank You!
Your report has been sent to our moderators for review