Alexandra Heath [*]
Head of Economic Analysis Department
CEDA's NSW Energy Series: Future energy projects
Sydney – 21 June 2016
It is a great pleasure to have the opportunity to speak to you today about the shifting state of global energy demand and the implications that this could have for the Australian economy. Developments in global energy demand and supply are important for forecasting Australian commodity exports and the prices we receive for them. Both affect the domestic economy through a range of channels the Bank has discussed at length on previous occasions.[1] The primary focus of the Bank's analysis is on the next three years or so, which is the timeframe that is generally relevant for assessing the appropriate setting of monetary policy. But we also look at the longer-term trends that underpin global energy demand and how well Australia is positioned to meet them. Today I will talk about the factors that are likely to be important for understanding the growth in global demand for energy and how the composition of that demand may change. Then I will discuss the outlook for Australia's energy exports, particularly thermal coal and liquefied natural gas (LNG).
Trends in global energy demand
There is a considerable degree of uncertainty about how global energy demand will evolve, and the further you look into the future, the greater that uncertainty becomes. We do know the growth in energy demand over the past couple of decades is unlikely to be sustained, partly because the drivers of that growth are likely to diminish and partly because energy efficiency increases over time.
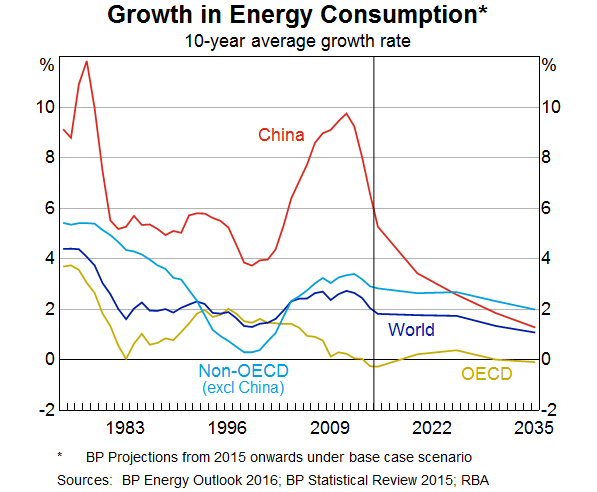
The relatively strong growth in demand for energy over the past decade or so has been closely tied to rapid industrialisation and urbanisation in several large emerging economies, most notably in China (Graph 1). However, economic growth is expected to slow as these economies mature.[2] The composition of growth in China has already started to shift away from the industrial sector towards services, which are typically less energy intensive: in 2015, the industrial sector consumed almost three quarters of total electricity to produce a bit less than half of nominal Chinese GDP, whereas the services sector produced around half of nominal GDP using a little over 10 per cent of electricity production. Indeed, the Chinese Government has been quite explicit about its medium-term goal of trying to rebalance growth in this way.
Graph 1
Another key factor that is likely to curtail growth of demand for energy is ongoing improvement in energy efficiency. Over time, the amount of energy required to produce a unit of output per capita has fallen. One driver of this trend is technological change. Increasingly, government policies designed to address environmental concerns have also played a role, particularly as awareness of the impact of climate change has grown. In China, concerns about harmful effects on the environment and quality of life from pollution are particularly acute and have motivated changes to government policy that are designed to improve energy efficiency.[3] According to the International Energy Agency (IEA), around 27 per cent of global energy consumption was covered by mandatory energy efficiency regulations in 2014, twice what it was a decade ago.[4]Some of these regulatory policies have already begun to affect demand and it seems fair to say that the focus on energy efficiency will increasingly weigh on global energy demand growth. The IEA has estimated that improvements in energy efficiency have meant that global energy consumption in 2014 grew by about one third of what it would have in the absence of these improvements.[5]
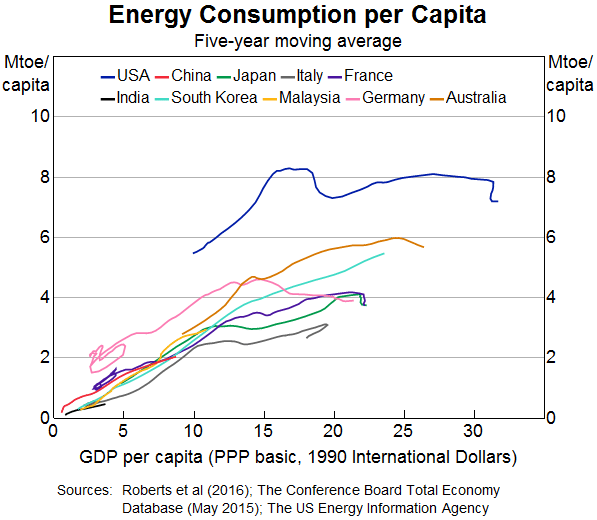
Although the rate of increase is likely to slow, a number of private and public sector institutions expect global energy demand to increase for the foreseeable future. Most of that growth is expected to come from non-OECD countries. China's current per capita energy consumption is low relative to many advanced economies, which suggests that there is room for expansion as the economy develops (Graph 2). India is another country where the push to industrialise and increase the population's access to electricity is likely to support energy demand for some time. Meanwhile, demographic and structural economic trends are expected to weigh on energy demand in OECD countries.
Graph 2
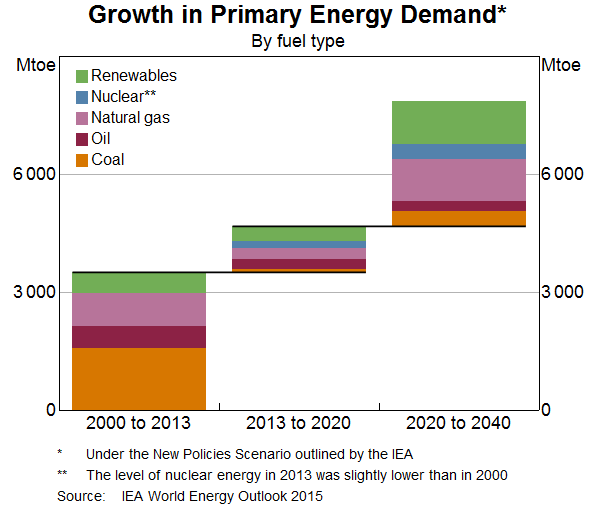
Longer-term projections for energy demand suggest that there is also likely to be a significant change to the energy mix, partly driven by environmental policies designed to favour lower-emission fuels, such as natural gas and renewable energy sources (Graph 3). The relatively low cost of coal-fired power generation, and its stability as a source of base-load power generation, is expected to support thermal coal demand over the medium term, particularly in China and India. However, demand for coal is not likely to increase significantly from current levels.
Graph 3
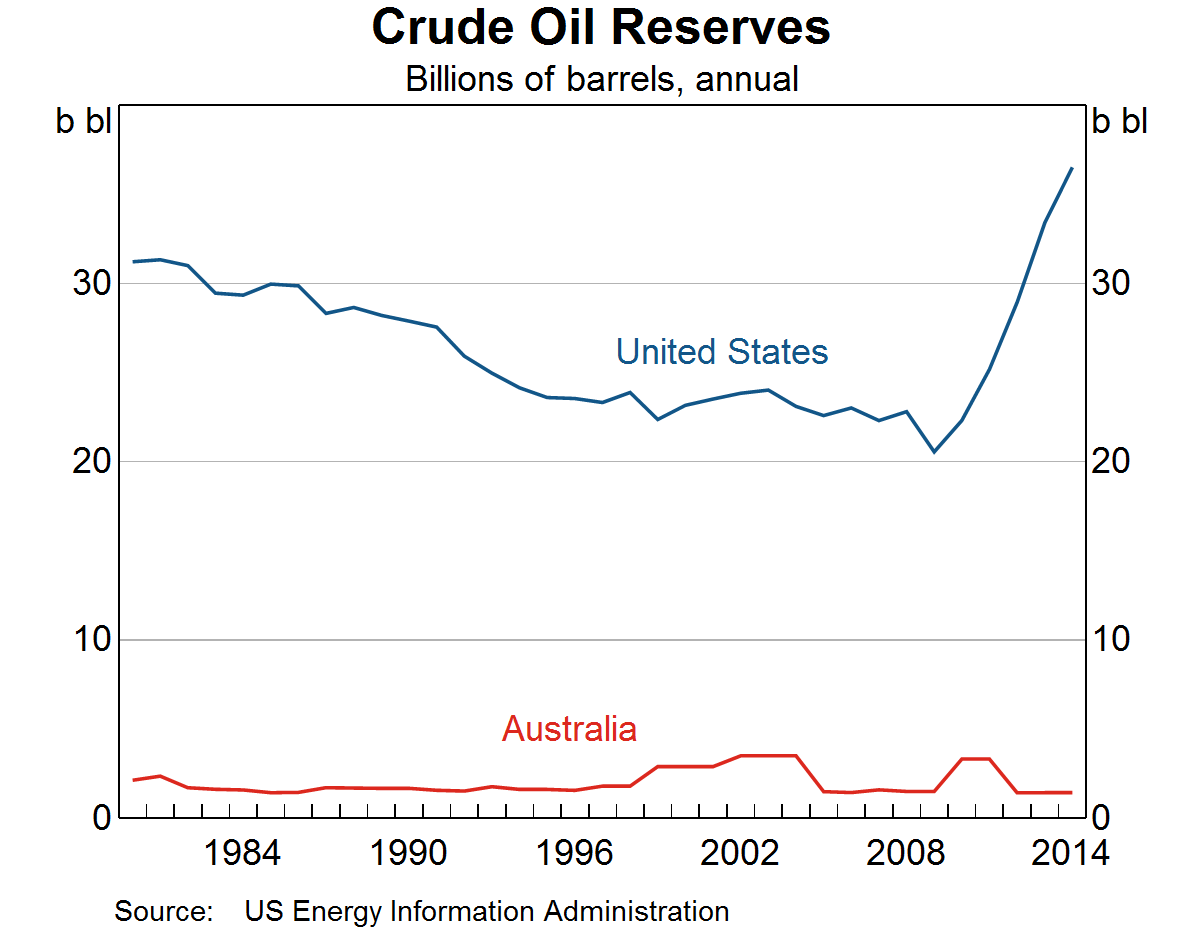
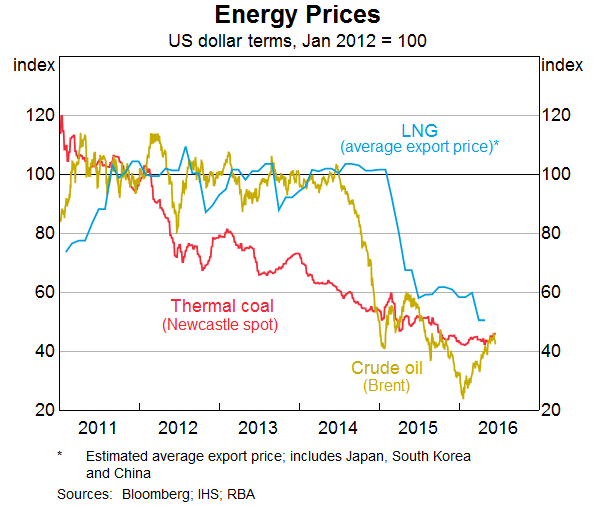
The energy mix will also depend on the relative prices for different fuels. Technological change has made it increasingly easy and affordable to access energy reserves that were previously deemed economically unviable. The most prominent example is perhaps the boom in shale oil and unconventional gas in the United States and elsewhere, which has led to a significant increase in the supply of energy commodities and contributed to a decline of more than 50 per cent in oil prices since 2013 (Graph 4). Technological developments are also driving increasingly efficient production of renewable energy sources, making them more competitive and affordable. The question is – how well is Australia positioned to meet changing global energy demand?
Graph 4
Australia's role in providing energy commodities
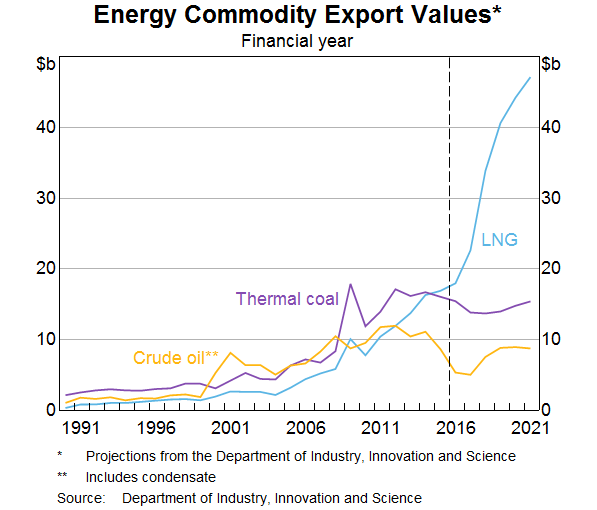
The increase in commodity prices, prompted by the increase in demand for raw commodities from emerging economies over the 2000s, sparked a substantial rise in mining investment in Australia. While much of this increased Australia's capacity to produce iron ore and coking coal to meet the increase in steel production in China, it also increased our capacity to produce and export energy commodities, especially LNG (Graph 5). Indeed, approximately $230 billion – equivalent to around 14 per cent of one year's worth of GDP – has been invested in Australia's capacity to produce LNG. As a result, Australia has increased in importance as a supplier of energy commodities, and growth in exports of thermal coal and, increasingly, LNG have made significant contributions to GDP growth.
Graph 5
But as the supply from Australia (and elsewhere) has increased and, more recently, demand has softened, prices of most energy commodities have fallen (Graph 6). This has posed challenges for less efficient Australian producers, and raises questions about the potential for Australia to supply the future increase in demand for energy.
Graph 6
Thermal coal[6]
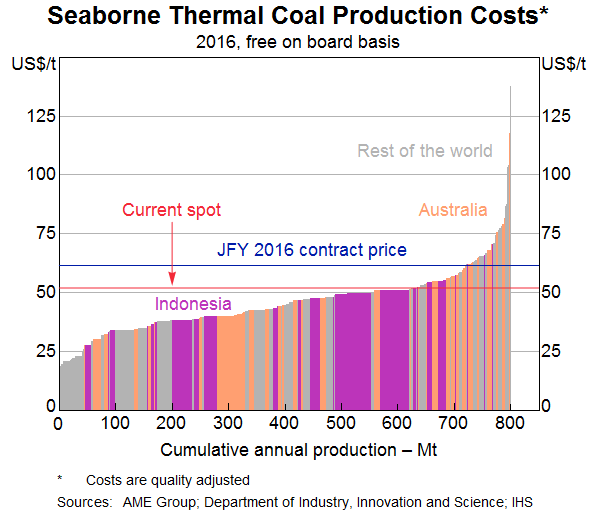
Given the falls in thermal coal prices over the past few years and the outlook for growth in thermal coal demand, the pace of expansion in the global seaborne supply of thermal coal is expected to slow over the next few years. There may also be a reduction in existing supply from higher-cost producers. Indeed, a significant share of Australia's thermal coal production is estimated to be unprofitable around current prices, and a substantial pick-up in global demand would be needed to see any sizeable growth in thermal coal exports from Australia (Graph 7).
Graph 7
LNG[7]
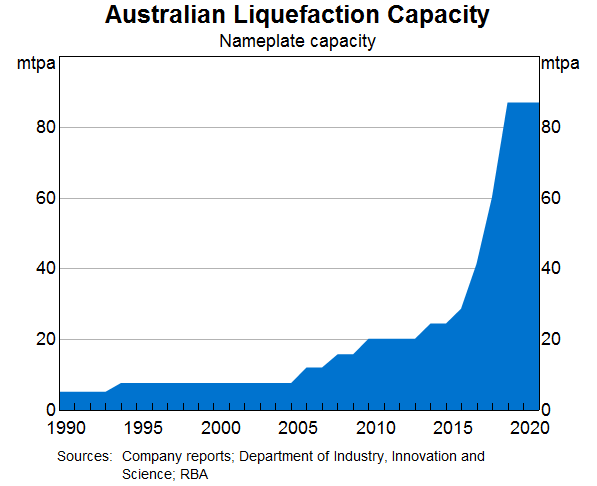
In contrast, Australian production of LNG is ramping up following the substantial increase in investment. Some of this increase in capacity was possible because developments in technology allowed new reserves to be accessed cost-effectively. For example, of the eight large-scale liquefaction projects that received approval and began construction over the past decade, three are unconventional coal seam gas projects in Queensland and one is among the world's first floating LNG vessels, to be located offshore in the Western Australian Browse Basin. These developments mean that Australia is expected to become the largest producer of LNG in the world with a total capacity of around 85 million tonnes per annum (Graph 8).
Graph 8
Geographically, Australia is well positioned to supply LNG to the Asian region, which is expected to drive much of the increase in demand for LNG in coming years. However, the viability of future projects, at least in the short-term, has been challenged by the fact that LNG prices in the Asian market have fallen in line with the price of oil, which is a close substitute, and potential Australian projects are generally considered to be higher cost than competing projects in other countries. However, the decline in prices is unlikely to lead to a significant reduction in production from existing producers because the high fixed costs of building the infrastructure have been paid and marginal production costs are relatively low. Ultimately, the outlook for LNG demand in Asia will depend on the availability and price of competing sources (including renewable energy), and the extent to which Asia's natural gas demand translates into demand for LNG (rather than pipeline gas imports or locally produced gas). Technological change is likely to be an important factor in determining the outcome.
Renewables
Usage of renewable energy sources, including hydro, wind and solar, is expected to grow rapidly, as their relative prices decline with technology improvements, and government policies support their widespread adoption to meet emission targets. Australia has an abundance of renewable energy sources, and there is significant potential for future development in these technologies. It is important that Australian companies remain at the forefront of developing expertise in these fields, not just for the environmental benefits that they will bring, but to be able to export these technologies to other countries. The future of renewable energy is particularly hard to predict but the rewards in terms of increasing productivity growth and diversifying the economy are potentially very large.
Conclusion
Energy demand is likely to continue growing, but less rapidly than it has been, partly because some large emerging markets are maturing. Technological progress and regulatory changes have also improved energy efficiency and changed the mix of energy that can be supplied cost-effectively. Australia's LNG exports are likely to continue growing for some time, whereas the prospects for growth of thermal coal exports are more limited. Our ability to benefit from rising demand for cleaner fuels will depend on our willingness to invest and innovate given the importance of technological change in the development of this segment of the energy complex.


Add a Comment
We encourage you to use comments to engage with other users, share your perspective and ask questions of authors and each other. However, in order to maintain the high level of discourse we’ve all come to value and expect, please keep the following criteria in mind:
Enrich the conversation, don’t trash it.
Stay focused and on track. Only post material that’s relevant to the topic being discussed.
Be respectful. Even negative opinions can be framed positively and diplomatically. Avoid profanity, slander or personal attacks directed at an author or another user. Racism, sexism and other forms of discrimination will not be tolerated.
Perpetrators of spam or abuse will be deleted from the site and prohibited from future registration at Investing.com’s discretion.