*
Assistant Governor (Financial Markets)
Speech to the Economic Society of Australia
Canberra - 15 April 2014
Thank you for inviting me to talk at the Economic Society here in Canberra. Today I am going to walk you through the current state of the Australian bond market. The bond market plays an important role in the financial structure of the Australian economy and it is timely to examine its structure and functioning with the financial system inquiry underway.
I will start today by providing an overview of the composition of the Australian bond market and how this has changed in recent years. Then, I will discuss more recent developments in the market since the start of 2013, focusing particularly on two trends that emerged last year: the nascent signs of deepening of the domestic corporate bond market and the pick-up in securitised issuance. I will also talk a little about the prospect for market-based finance, of which bond issuance is an important part, playing a larger role in the future than it currently does.
Shape of the Australian Bond Market
The evolution of the Australian bond market over the past several years has been shaped to a large extent by the fallout from the global financial crisis. Prior to the crisis, the market comprised mainly bonds issued by the Australian banks and asset‑backed securities. Together these accounted for just over half of the outstanding stock of Australian bonds in June 2007. Bonds issued by the public sector were a relatively small share of the market, at 16 per cent of the total outstanding (Table 1).
Overall, the size of the bond market in mid 2007 was equivalent to around 84 per cent of Australia's annual GDP. In the subsequent seven years the stock of Australian bonds on issue has increased to reach the equivalent of nearly 100 per cent of GDP. The increase has mainly been the result of debt issuance by the Commonwealth and state governments to finance their budget deficits as they sought to support economic growth through the crisis. Bank bond issuance has slowed down in the last couple of years as Australian banks have sought to shift towards more deposit funding. However, the stock of bank bonds on issue is significantly higher than it was just before the start of the global financial crisis, reflecting the strong issuance of bank bonds in 2008 and 2009 as the financial system was re-intermediated because other forms of non-bank financing dried up.[1] One of the areas of the market that suffered the greatest impact from the crisis was asset‑backed securities, due to the loss of investor confidence in this asset class globally. This resulted in the stock of outstanding Australian asset-backed securities nearly halving, in nominal terms, and declining three-fold relative to GDP since mid 2007.
Table 1: Please see http://www.rba.gov.au/speeches/2014/sp-ag-150414.html
Overview of Developments Since 2013
Conditions faced by Australian bond issuers have continued to improve since early 2013, reflecting the markedly better conditions in global financial markets as the global economic recovery has become more entrenched and as European sovereign debt concerns have eased.
Issuance has been generally strong and has been met by robust domestic and offshore demand. The only exception to this was the month of June which saw virtually no issuance of non-government bonds as issuers and investors stood on the sidelines while financial markets were assessing the prospects and implications of the start of the US Federal Reserve's tapering to its asset purchases program. However, this episode proved short-lived, with Australian and global bond market activity resuming quickly and continuing apace when tapering actually started in December.
The past year in the Australian bond market has been most notable for the signs of the improvement in investor sentiment extending along the risk spectrum towards lower rated corporate bonds and to parts of the fixed income market that have been, unfairly, at least in the case of Australia, tarred by the loss of global investor confidence. Issuance in the domestic market of lower-rated corporate bonds, which in the case of Australia means those rated BBB+ to BBB−, was the strongest on record, and, notably, at longer than usual maturities. The securitisations market, particularly for residential mortgage-backed securities (RMBS), also recorded a significant increase in activity.
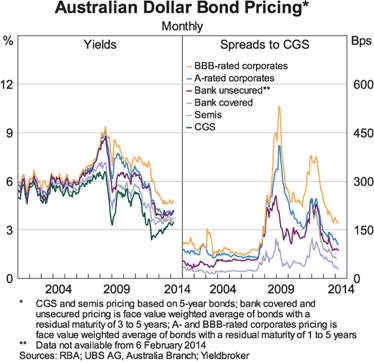
These trends in issuance were also reflected in the pricing of Australian bonds, with the difference in yields between these bonds and CGS narrowing across the risk spectrum since early 2013 (Graph 1). Although, the pace of narrowing has slowed relative to 2012, spreads are now at their lowest levels since the end of 2007. Borrowing costs for Australian corporates and states are at very low levels historically, while wholesale funding costs for banks, which are more a function of bond spreads rather than bond yield levels, have declined further.
Graph 1
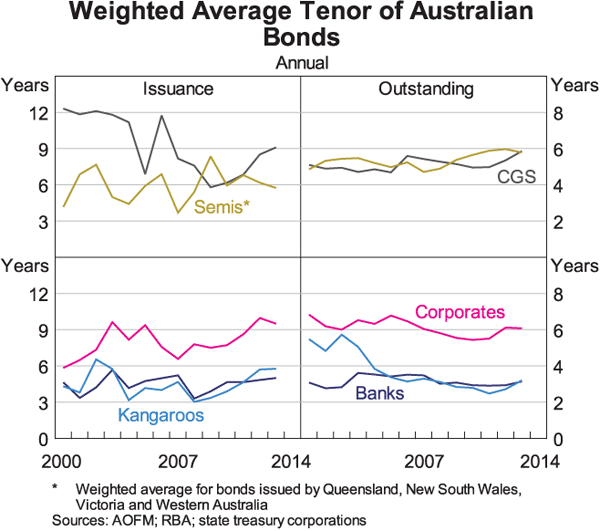
A further sign of the improved market conditions has been the continual extension in bond maturities across most market segments (Graph 2). The lengthening in maturities reflects principally two developments: improvement in overall risk sentiment; and the search for yield in a low interest rate environment pushing investors out along the yield curve in search for yield pick‑up.
Graph 2
Recent Issuance Trends
I will now go through these developments in more detail.
Public sector
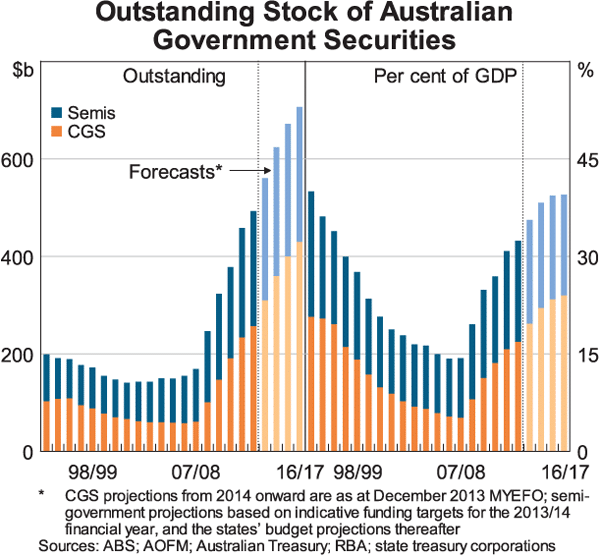
Since 2013, net issuance of CGS and semis has slowed down from the pace in recent years. Based on the latest borrowing programs and budget forecasts, the stock of public sector bonds outstanding is expected to increase to around 40 percent of GDP by 2016/17, before stabilising at that level (Graph 3). As you are aware, this is considerably lower than in most other countries. Beyond 2016/17, it is desirable to maintain a reasonable amount of CGS on issue to support a liquid government bond market and thereby provide a risk-free curve off which other debt instruments can be priced.[2]
Graph 3
Demand for Australian public sector debt has remained high due to Australia's solid economic performance and high credit ratings of the public sector. The federal government is currently one of only 13 AAA-rated (by S&P) sovereigns globally, attracting continuing demand for CGS, particularly from official reserve managers. This demand has facilitated the lengthening in the maturity profile. In November last year, the AOFM issued a 20 year nominal fixed rate bond raising $5.9 billion. This was Australia's largest bond issue (until the $7 billion 2026 CGS issue in March this year) and it generated significant demand with nearly $9 billion in bids and 60 per cent foreign investor participation.
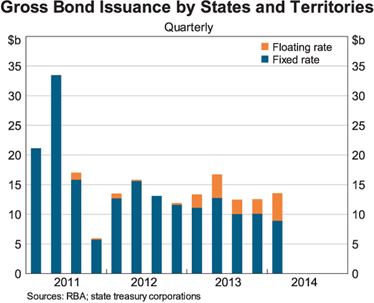
Bond issuance by the state borrowing authorities in recent years has featured increasing issuance of floating-rate notes (FRNs). Since early 2013 around one quarter of the issuance has been FRNs (Graph 4). The increased FRN issuance has been designed to meet the demand for such paper from banks who want to hold state government paper to meet the soon to be implemented prudential liquidity requirements.[3] Banks have a natural preference to hold FRNs to match the floating rate nature of their liabilities.
Graph 4
Financial sector
Gross bond issuance by Australian banks over the past year has been around its average level since 2007. Roughly three-quarters of banks' issuance was offshore, mainly in US dollars and euros. Banks have slowed down their issuance of covered bonds now that their covered bond programs are maturing, having only been able to issue under them since late 2011 (Graph 5).[4]
Graph 5
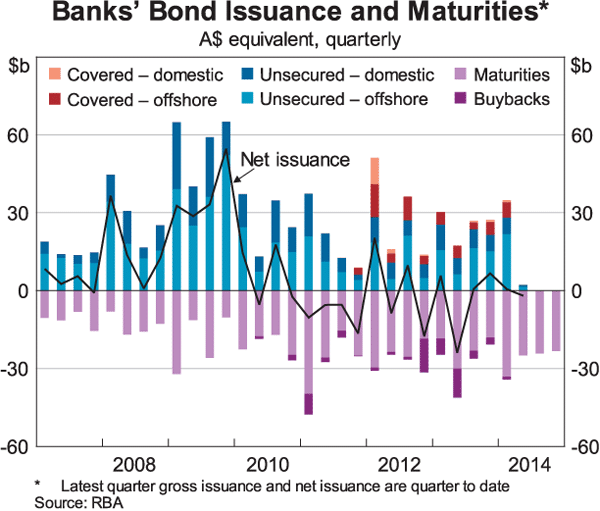
There has been minimal net bank bond issuance in recent times, with banks basically content with their existing level of bond funding.[5] Banks have been comfortably able to fund asset growth (which has been relatively subdued) with deposits.[6]
Securitisations
The continual improvement in broad market sentiment has been seen strongly in the Australian asset-backed market, particularly in the market for RMBS. The volume of issuance of RMBS in 2013 was the highest since 2007 (Graph 6). The majority of issuance continues to be in Australian dollars, as has been the case in recent years, and in fact, the total Australian dollar issuance in 2013 was only exceeded by the level of Australian dollar issuance in the two and a half years immediately preceding the onset of the financial crisis.
Graph 6
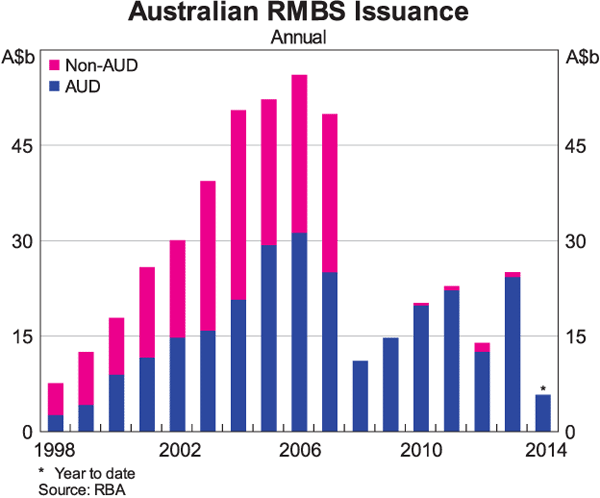
Despite the low level of foreign currency issuance in 2013, foreign investor demand for Australian RMBS has been quite high, reflecting the lack of supply of RMBS in foreign markets, the global search for yield, and confidence in the high quality of the underlying collateral of Australian RMBS. Publicly available data indicate that, on average, around 40 per cent of each deal in 2013 was placed with foreign investors, and foreign investor participation at issuance has increased significantly.
The gradual improvement in RMBS market conditions since mid 2012, particularly the increase in private investor demand, led to the AOFM ceasing its RMBS purchases in 2012 and the government announcing the formal end of the AOFM's RMBS investment program in April 2013. Since the start of 2013, the AOFM has sold around $1 billion of its RMBS holdings in five transactions, including in February this year the sale of a large part of its holdings of mezzanine tranches following strong investor demand for such exposures.
The improvement in the RMBS market conditions has also been reflected in a number of other dimensions:
Deal sizes have increased, especially for RMBS issued by the major banks, where the average size has increased to $2.5 billion.
Issuance has picked up not only for the major banks but also for regional banks and non-banks (i.e. credit unions and mortgage originators), with a number of smaller issuers returning to the market after an absence of several years.
RMBS issuance spreads, over the last year or so, have remained at their lowest level since mid 2007; despite the significantly larger volume that has been brought to market (Graph 7).
Graph 7
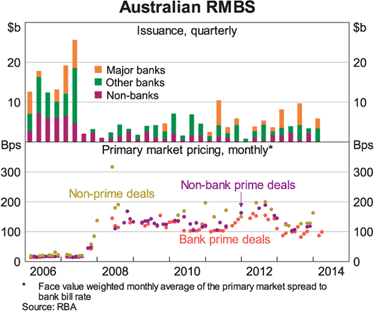
Deal structures have continued to evolve with further issuance of bullet tranches to manage prepayment risk. One recent deal was structured without a serial pay trigger, which has been the norm in recent years, apparently in anticipation of the changes to the APRA's prudential standard on securitisations outlined late last year.[7]
2013 saw the first Australian CMBS issue since 2011, and although volumes have remained low this has been followed by a further two transactions. Issuance of other ABS has remained strong, with 2013 recording the highest level of gross issuance on record with a sizable pick-up in Australian dollar issuance.
Corporates
Australian corporates have continued to have good access to bond markets both domestically and offshore, raising a total of $35.1 billion of new bonds since the start of 2013 (Graph 8). While the amount issued has been less than in 2012, issuance that year was underpinned by significant bond issuance by the large Australian miners. Part of the reason for that strong issuance was that the miners were able to access the market at least as cheaply as the banks, so this was very cost effective for them. As these companies have reduced capital expenditure, their need to tap the bond market for long-term funding has declined, leading to a drop-off in their bond issuance.
Graph 8
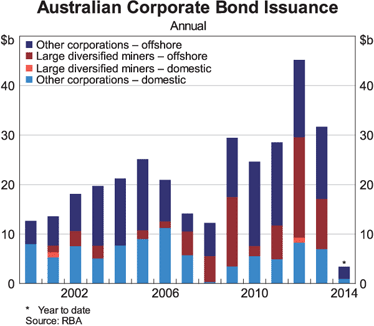
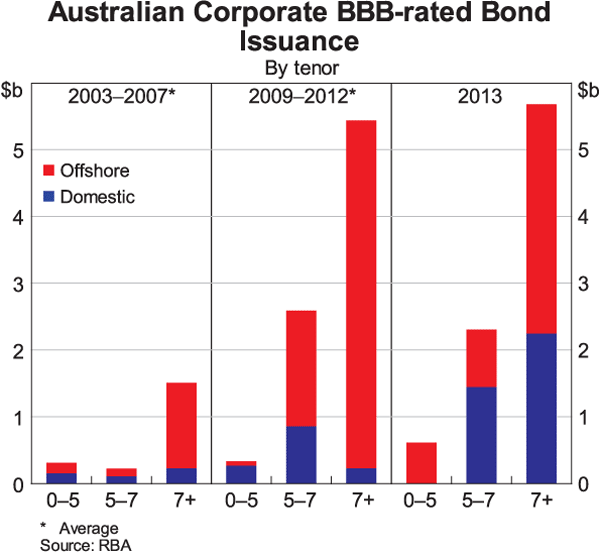
The main development in the corporate bond market over the past year or so has been the significant pick-up in lower rated issuance into the domestic market and at longer maturities than have been previously achieved domestically. While domestic tenors remain well below the tenors at which corporates can raise bond funding in some offshore markets, particularly in the US, this is a very much welcomed development, reflecting the continuing maturity of the domestic market. Investors have become more comfortable with moving up the maturity spectrum and down the ratings spectrum in the domestic market in order to pick up yield and corporates are finding the pricing more attractive. The seven year maturity was the favoured point for the domestic issuance by BBB+ to BBB− rated Australian corporates, with $2.2 billion raised by 9 issuers across 10 bonds (Graph 9). How much of this will be sustained when we are no longer in a very low interest rate environment remains to be seen.
Graph 9
Last year, the Reserve Bank began publishing more comprehensive measures of spreads and yields on Australian non-financial corporate bonds, covering points on the yield curve up to 10 years.[8] This additional information will bring greater transparency about bond market conditions faced by these issuers.
Investor Base
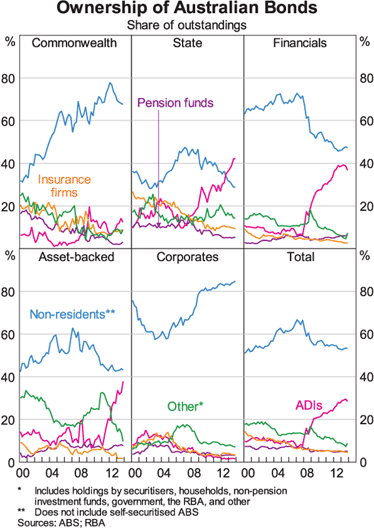
Non-residents' demand for Australian fixed income securities remains strong. This is particularly the case for CGS, where the share of the market held by non-residents remains close to its historical high, despite declining slightly in mid 2013 (Graph 10). A sizeable share of this demand comes from official reserve managers who are attracted to the relatively higher yield on Australian government bonds, the high and stable credit rating of the Australian government and Australia's strong and stable economic performance. Non-residents' holdings of semis have continued to decrease, while the semis holdings of Australian banks have continued to increase. This reflects the demand for semis from the Australian banks, given that these securities qualify as high quality liquid assets under APRA's rules, and offer a (small) yield pick-up over the other high quality liquid assets in Australia, CGS. The share of holdings of financial bonds by non-residents remains below the pre-crisis level as the Australian banks have reduced their funding sourced from offshore. On the other hand, the share of non-residents' holdings of Australian corporate bonds remains at a historically high level as Australian corporates have continued to have good access to international bond markets.
Graph 10
Conclusions
Although Australia avoided most of the more severe disruptions in financial markets during the global financial crisis, the turmoil has left its mark on the Australian bond market landscape. Conditions in financial markets have been improving steadily since mid 2012; 2013 and the first quarter of this year have resembled what normal bond market conditions may look like in a post crisis world. Looking forward, we can expect the Australian bond market to solidify this normalisation. Credit spreads are likely to remain higher than their pre-crisis levels, reflecting the repricing of credit and liquidity risk, while yields are likely to remain low for some time as central banks only gradually normalise their monetary policy settings.
We are likely to see some further growth in the size of the public sector bond market in Australia for a little while longer, but the stock of outstanding bonds is expected to stabilise as a share of GDP by mid 2017. Issuance by the Australian banks is likely to remain subdued as they continue to favour deposit funding.
Total corporate bond issuance may remain subdued in the near term as the main potential issuers – the large diversified mining companies – have a focus on increasing production from already developed projects, containing capital expenditure, and, more broadly, large Australian companies have accumulated significant cash balances since mid 2007.
However, while bank-based finance remains dominant today, in the future we may well see the Australian financial system move to more market-based sources of finance, particularly bond issuance. The regulatory changes have increased the relative cost of bank intermediation, as liquidity is now more appropriately priced and the cost of maturity transformation has increased. As a result, market-based sources of finance are now more cost effective for a wider range of companies and one would expect them to respond to this with increased bond issuance.
At the moment, parts of the corporate sector can access the bond market at a cheaper price than banks can. As mentioned earlier, there has been increased appetite for debt issued by lower-rated companies at attractive prices for the issuer and at longer maturities than they would normally get from a bank. How much of this is a function of the current global interest rate environment remains to be seen, but there is a reasonable prospect that some of these developments will be long-lasting.
Endnotes
* I would like to thank Ivailo Arsov, Mathew Brooks and Karl Stacey for their assistance in preparing this speech.
The developments in the Australian bank bond market between mid 2007 and 2009 are covered in more details in Black S, A Brassil and M Hack (2010), ‘Recent Trends in Australian Banks' Bond Issuance’, Reserve Bank of Australia Bulletin, March, pp 27–33. More recent developments in the banks' bond issuance are covered in Berkelmans L and A Duong (2014), ‘Developments in Bank's Funding Costs and Lending Rates’, Reserve Bank of Australia Bulletin, March, pp 69–75.
The Australian government announced in its 2011/12 Budget that in order to support a liquid and efficient bond market it will aim to maintain the stock of outstanding CGS at around 12 to 14 per cent of GDP, a level which the Reserve Bank views as appropriate for this purpose. For more details see Australian Government (2011), ‘Budget Strategy and Outlook 2011-12’, in Budget Paper No. 1, 2011/12 Australian Government Budget, Commonwealth of Australia, Canberra, pp 7-16–7-18. Available at <http://budget.gov.au/2011-12/content/bp1/html/index.htm>.
The liquidity coverage ratio (LCR) requires banks to hold a proportion of their assets in high-quality liquid assets (HQLA). In Australia, only Commonwealth and state government debt are eligible securities as HQLA. Banks are required to limit their holdings to around 30 per cent of the stock on issue of these assets, to avoid impairing the liquidity in the market of holding higher amounts.
For a more in-depth discussion of the evolution of the Australian covered bonds see Aylmer C (2013), ‘Developments in Secured Issuance and RBA Reporting Initiatives’, Address to the Australian Securitisation Forum, Sydney, 11 November.
One area where there has been stronger growth has been in the area of subordinated debt, with the banks issuing new Basel III compliant securities to refinance legacy Tier 1 and Tier 2 securities and to meet strong investor demand.
The stock of outstanding government‑guaranteed bonds has declined to around $23 billion, reflecting maturities and buybacks. The remaining government-guaranteed bonds mature over the next 12 months.
For an outline of APRA's proposed reforms to APS 120 see Littrell C (2013), Prudential Reform in Securitisation, Presentation to the Australian Securitisation Forum, Sydney, 11 November. Available at <http://www.apra.gov.au/Speeches/Documents/CharlesLittrell-Australian-Securitisation-Forum-11November2013.pdf>. One of the major thrusts of the proposed changes is the introduction in the prudential standards of the so called ‘skin in the game’ for ADI issued RMBS. RMBS issued since mid 2007 have typically included a serial pay trigger which after certain conditions are met, mainly satisfactory deal performance for several years after issuance, switch the principal payment order from paying tranches in order of seniority to paying all, or most tranches, proportionately to their outstanding amount. This feature was introduced in the market to address the higher cost on junior tranches in the wake of the global financial crisis and for ADI sponsored RMBS, where the sponsor has been limited to hold no more than 20 per cent of the deal to qualify for capital relief, to cap the share of the RMBS held by the ADI.
For details on the new measures of credit spreads see Arsov I, M Brooks and M Kosev (2013), ‘New Measures of Australian Corporate Credit Spreads’, Reserve Bank of Australia Bulletin, December, pp 15–26.


Add a Comment
We encourage you to use comments to engage with other users, share your perspective and ask questions of authors and each other. However, in order to maintain the high level of discourse we’ve all come to value and expect, please keep the following criteria in mind:
Enrich the conversation, don’t trash it.
Stay focused and on track. Only post material that’s relevant to the topic being discussed.
Be respectful. Even negative opinions can be framed positively and diplomatically. Avoid profanity, slander or personal attacks directed at an author or another user. Racism, sexism and other forms of discrimination will not be tolerated.
Perpetrators of spam or abuse will be deleted from the site and prohibited from future registration at Investing.com’s discretion.