Philip Lowe
Deputy Governor
Committee for Economic Development of Australia (CEDA)
Melbourne – 9 September 2015
I would like to begin by thanking the Committee for Economic Development of Australia (CEDA) for the invitation to address this lunch. It is a pleasure to be able to speak at another CEDA function, particularly one here in Melbourne.
A central theme of the Reserve Bank of Australia's (RBA) communication over the past few years has been that the Australian economy is in a period of transition: a transition from the biggest resources boom in over a century to something a bit more normal. The sheer scale of the resources boom means that this transition has its challenges. And these challenges are being compounded by what is happening beyond our shores.
A second theme of our communication, however, has been that a reasonably successful transition is possible, and indeed, probable. This assessment reflects the positive fundamentals of our economy, as well as its underlying flexibility. This flexibility helped us deal with the upswing of the resources boom and is now helping us deal with the downswing.
And a third theme of our communication has been that monetary policy is helping this adjustment, but that the likelihood of a successful transition would be boosted by a lift in underlying productivity growth and an increase in the expected risk-adjusted return on capital formation – both physical capital and human capital.
Today, I would like to take this opportunity to touch on each of these three themes. I think it is useful to start with recent developments in the global economy, particularly in China, as they form an important backdrop to the adjustment that we are going through. And then I would like to focus on the ongoing adjustment in our own economy.
Global Developments
So, first to the global backdrop.
Perhaps the main news over the past month or so is that from China. In particular, two developments in Chinese financial markets have caught people's attention. The first is the very sharp decline in the Chinese equity market and the second is the decision by the Chinese authorities to allow the renminbi to depreciate against the US dollar.
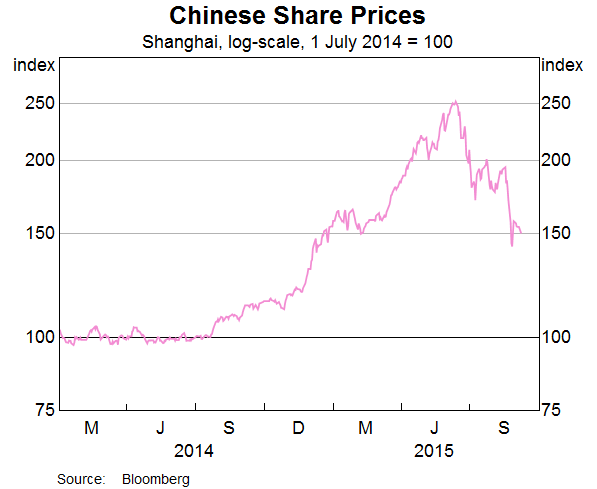
In the Chinese equity market, prices have fallen by almost 40 per cent since mid June (Graph 1). This fall has reversed around two-thirds of the increase that occurred over the previous year. The reasons for this earlier increase are not entirely clear. One possible factor was an easing of some restrictions on margin financing. Another was an expectation by Chinese citizens of future capital gains, perhaps as the equity market opened up to increased investment from overseas. A third was the weakness in residential property markets. Whatever the reason, as so often happens, things went too far. Many investors thought the increase in equity prices would keep going and many borrowed money to get a bigger stake in what was a rising market. A bubble developed. And then it burst. While this attracted much attention, these movements in the Chinese equity market are likely to have only limited implications for the overall Chinese economy.
Graph 1
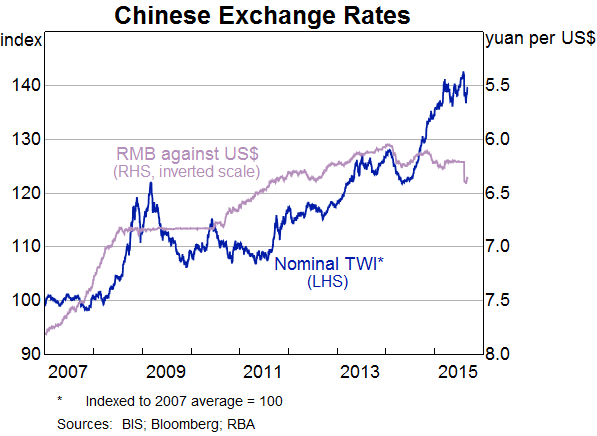
In terms of the exchange rate, for much of the past few years, the renminbi has moved closely with the US dollar (Graph 2). This meant that as the US dollar appreciated, so too did the Chinese currency; on a trade-weighted basis, the renminbi had appreciated by around 15 per cent between mid 2014 and the end of July this year.
Graph 2
With the US and Chinese economies being in different phases of the business cycle, it is unsurprising that the Chinese authorities might have come to the conclusion that greater flexibility of the renminbi against the US dollar was warranted. Notably, a move in this direction is also consistent with the authorities' long-standing goal of transitioning to a more market-determined exchange rate. While the change in the Chinese exchange rate also attracted much attention, the magnitude of the change does need to be kept in some perspective. At around3 per cent, the recent depreciation is hardly out of line with the short-term movements that are sometimes seen among the major freely floating currencies of the world.
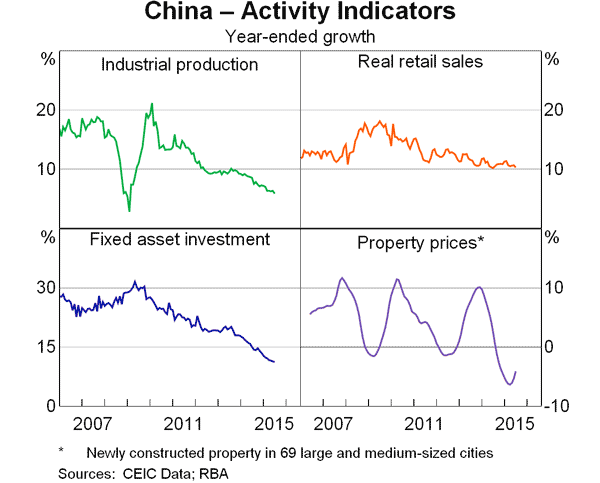
These developments in the Chinese financial markets have coincided with signs of some further slowing in the Chinese economy. Many of the recent indicators – including those for industrial production, fixed asset investment and retail trade – have been somewhat softer than earlier in the year (Graph 3). The same is true for various business surveys and Chinese exports. In contrast, one area that has looked a little more positive of late is the residential property market. In some of the larger cities, property prices have been increasing again, although construction activity has yet to pick up noticeably.
Graph 3
Over the past month, the news out of China has had significant ripple effects on global equity markets. Volatility has picked up and many of the major equity markets are down around 10 per cent from their levels a few months ago. Volatility has also picked up in commodity markets and most commodity prices are also lower than a few months ago. It is noteworthy though that this increased volatility in equity and commodity markets has not led to dislocation in other financial markets. In particular, there has not been a deterioration in funding markets and credit spreads have mostly moved in a relatively narrow range.
This recent focus on developments in China has, understandably, thrown the spotlight on the outlook for the Chinese economy. Assessing this outlook is complicated by the fact that China is simultaneously adjusting to slower growth in potential output and dealing with a relatively soft phase of its own business cycle.
The slowing in potential output growth – after an extraordinary period of sustained double-digit growth – was inevitable and, indeed, widely expected. It has, however, brought into sharper focus some of the structural challenges facing the Chinese economy. These include:
- the challenge of shifting from investment-led to consumption-led growth
- the challenge of liberalising the markets for important factors of production – including labour, land, capital and energy
- the challenge of demographic change, with the Chinese working-age population now declining and the overall population ageing
- the challenge of dealing with various strains and distortions in the financial system and the property market.
At various times the Chinese authorities have acknowledged each of these challenges and a range of plans has been developed to deal with them. However, how successful these plans ultimately turn out to be is yet to be seen. There is no doubt that the economic outcomes in China over the past few decades have been remarkable, with hundreds of millions of people being lifted out of poverty. The challenges, however, are not getting any easier, and the authorities' recent handling of the stock market crash has led some to ponder the general direction of Chinese policy, including the likely pace of reform across the economy. This is an issue that will bear close watching over the months ahead.
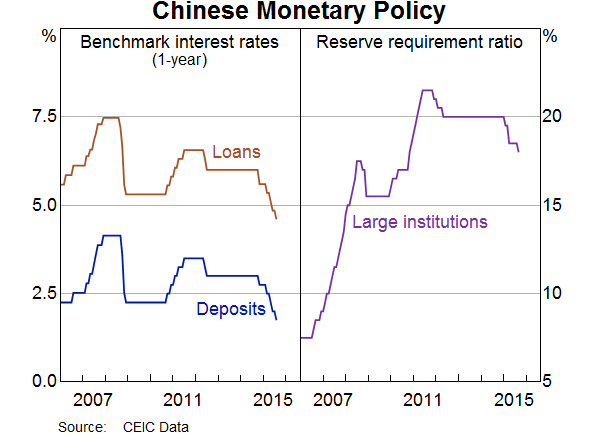
From a cyclical perspective, the Chinese authorities have taken a number of steps recently to support growth. Increased spending on infrastructure is one of these. Nominal benchmark interest rates have been reduced, although with inflation declining, real rates have tended to rise over the past year (Graph 4). Reserve requirements in the banking system have also been lowered, although this was designed to offset the withdrawal of liquidity that has taken place as the Chinese authorities have sold foreign exchange reserves in response to private capital outflow from China. The depreciation of the renminbi against the US dollar can also be expected to provide some support, at the margin, to the Chinese economy.
Graph 4
So, overall, it is a complicated picture at present in Australia's largest single trading partner. We became used to extraordinarily strong growth in China and now we are having to get used to something a little less extraordinary, and we are also being reminded that China too has a business cycle. Nevertheless, it remains the case that there are still significant mutually beneficial opportunities from deeper economic relations between Australia and China. As a nation, we need to keep an eye on these opportunities, while, at the same time, understanding and managing the associated risks as best we can.
Elsewhere, the recent economic data have mostly had a slightly more positive tone. The US economy is recording above-average growth and the unemployment rate is around most estimates of full employment. In Europe, the economic news has recently tended to be a bit better than it had been earlier in the year and a recovery, of sorts, is taking place there. In India, too, the growth momentum looks to have improved, although in a number of countries in east Asia, both domestic demand and export growth have slowed.
For the globe as a whole, economic conditions continue to be supported by the decline in oil prices. In addition, the drag from fiscal consolidation has lessened in several countries. Monetary conditions also remain very accommodative. At some point before too long, we should hope that the US economy is sufficiently strong for the Federal Reserve to begin the process of normalising interest rates there. A stronger US economy should be good for the rest of the world, although financial market developments will need to be watched carefully given that the policy interest rate in the United States has been at zero for almost seven years now.
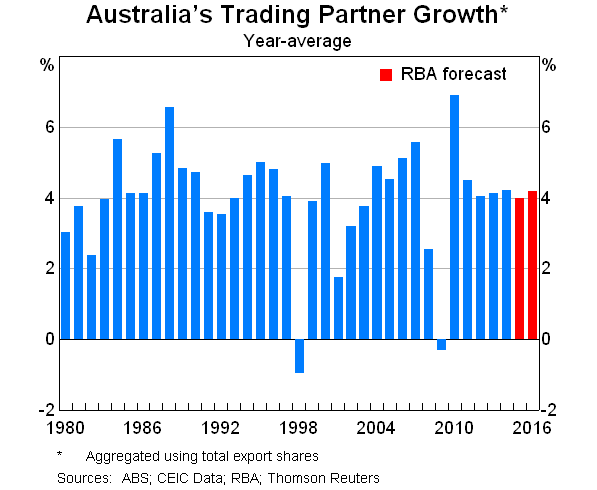
Putting all this together, when the RBA published its latest forecasts a bit over a month ago, we were expecting GDP growth in our trading partners to be around average over the next couple of years (Graph 5). While recent news on global industrial production has been softer, on balance, the recent data have not changed this general outlook materially. We still expect GDP growth in our trading partners to average around 4 per cent over 2015 and 2016, although given recent developments in east Asia the risks around this central forecast are tilted a little to the downside.
Graph 5
The Domestic Transition
I would now like to turn to the adjustment in the domestic economy.
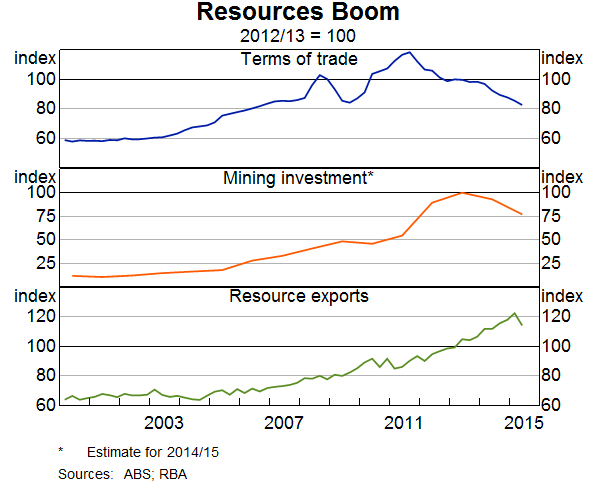
The broad story here is well known. Over the past decade, Australia has experienced an extremely large external shock in the form of a resources boom (Graph 6). This shock has had three phases.
Graph 6
The first phase was a very large increase in commodity prices.
The second was a very large increase in resources sector investment.
And the third phase is a very large increase in resources sector production and exports.
While these various phases have overlapped at times, we are now very much in this third phase, in which higher production is generating increased exports, but commodity prices are much lower than they were a few years ago and resources sector investment is returning to more normal levels.
During the first two stages there was a significant reallocation of resources within the Australian economy. This was important in avoiding the overheating that had characterised previous resources booms. But an adjustment back the other way is now taking place, and has been for some time.
Indeed, the terms of trade have been declining for almost four years now, after having peaked in the second half of 2011. Over this period, the global supply of commodities has increased substantially as new investment projects have come on stream over the past four years. Largely as a result, the prices of our exports relative to our imports have fallen by around 30 per cent. This decline brings the terms of trade back to around their level in the mid 2000s, which was considerably higher than their average of the 1990s.
The peak in mining investment occurred around a year after the peak in the terms of trade. In mid 2012, mining investment reached a record high of around $30 billion per quarter. Since that time, it has fallen significantly to be around $20 billion in the June quarter this year. Further declines still lie ahead as more projects are completed, although the end of these large declines now looks to be coming into sight; our current forecasts have mining investment declining to around $10 billion per quarter by the end of 2017. If this does turn out to be the case then we are currently roughly halfway through the decline in mining investment.
In contrast, the ramp-up in resources sector output is still under way. Over the past three years, resource exports are up by 20 per cent and annual increases of around 9 per cent are expected over the next couple of years as LNG production increases. While there is inevitably a degree of imprecision in the estimates, this increase in LNG exports is expected to boost GDP growth by an average of around ¾ percentage point in each of 2016 and 2017.
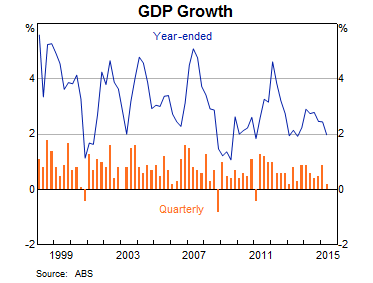
Through this third phase of the mining boom, the economy overall has been growing at an annual rate of between 2 and 2½ per cent (Graph 7). The quarterly readings for GDP continue to be affected by fluctuations in mining production due to the weather. But looking through this volatility, the data for the June quarter suggest that the economy is continuing to grow at a similar rate to that of the past few years.
Graph 7
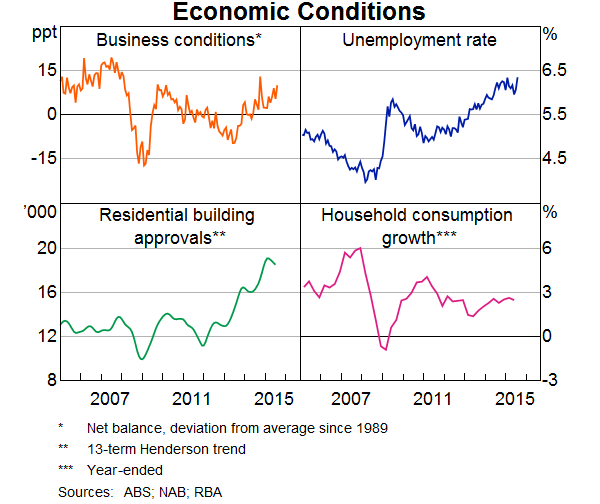
Most other recent indicators are also consistent with a moderate expansion in the Australian economy. Measures of business conditions have improved and most are now above average. The unemployment rate has been little changed over the past year and the demand for labour has increased, with a rise in employment relative to the working-age population. The housing cycle remains in an upswing and household consumption is growing moderately (Graph 8).
Graph 8
For many in the community, the fact that growth is occurring at only a moderate pace is disappointing. Growth has been slower than we had become used to, and slower, I think, than we are capable of. And, in terms of our incomes, this has been compounded by the decline in prices of resource exports. As a result, there has been very little growth in our real income per capita for some years now, after a decade and a half of very strong growth.
While this disappointment is understandable, we should not lose sight of the fact that our economy has shown considerable ability to adjust, and to do so in a way that has preserved both overall economic and financial stability. We have adjusted to the upside of a huge positive international demand shock without overheating and we are now adjusting to the downside while still managing to grow at a moderate rate. This is a significant achievement and is a testimony to the underlying flexibility of our economy. This flexibility should give us come confidence about the future.
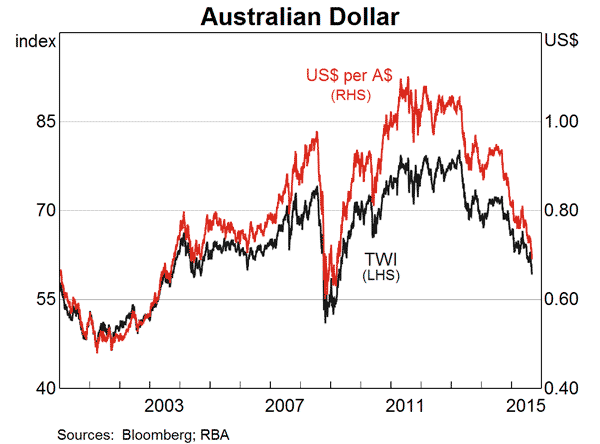
An important element of this flexibility is the exchange rate (Graph 9). When the terms of trade initially started to fall and the decline in mining investment was clearly in sight, the exchange rate was relatively slow to adjust. On a number of occasions, the RBA drew attention to this. But the exchange rate has now adjusted considerably and this adjustment has continued over recent weeks. Just as the appreciation helped stabilise the economy in the upswing of the boom in commodity prices and mining investment, the depreciation is helping in the downswing.
Graph 9
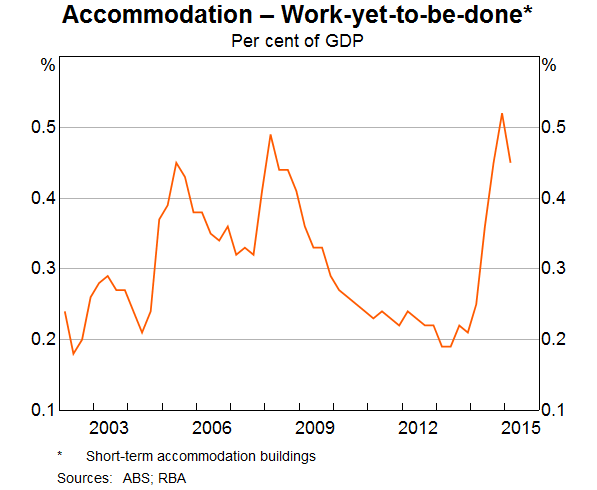
One example of this is in the tourism industry. As the relative cost of overseas travel has increased, more Australians are holidaying domestically and more people are visiting our shores. Encouragingly, we are now seeing some signs that this change in travel patterns is prompting a pick-up in investment in the tourism industry. In particular, there has been a noticeable increase in the stock of work to be done in the construction of hotel and related accommodation (Graph 10). The RBA's liaison with tourism-related businesses suggests that further increases in investment in this area are likely in coming years. Conditions have also improved in a number of other sectors that are sensitive to the exchange rate.
Graph 10
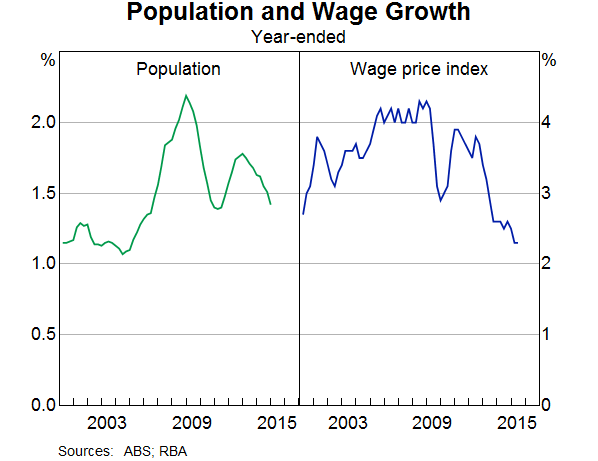
Another element of the flexibility has been the labour market, both in terms of labour supply and wages (Graph 11). During the upswing, population growth picked up noticeably, partly due to a rise in immigration. This helped alleviate some of the pressures in the labour market that would have otherwise occurred, especially in areas where skills were in short supply. In the downward phase, population growth has slowed, again partly due to immigration. Aggregate wage growth has also moderated significantly. This has played some role in generating sufficient employment growth over recent times to keep the unemployment rate steady despite the below-average growth of the overall economy.
Graph 11
A third element of this flexibility has been monetary policy. As the RBA has frequently noted, it is entirely appropriate that, during a period in which both the terms of trade and mining investment are declining, monetary policy is accommodative. Monetary policy is helping support growth in the overall economy even if it is not working in quite the same way as it once did. This support is most clearly evident in the interest-sensitive housing construction sector, where investment has increased by 7 per cent over the past year. The stronger housing market is also having some positive ripple effects on parts of the retail sector.
So, together, the flexibility of the exchange rate, the labour market and monetary policy is helping with the cyclical adjustment in our economy. The missing ingredient continues to be a lift in non-mining business investment, where we are still waiting for convincing signs of a pick-up. The latest reading from the Australian Bureau of Statistics on firms' capital spending plans outside the resources sector did show a slight improvement from earlier readings, but a material lift in non-mining business investment still seems to be some way away.
In time, though, we should expect that the adjustments that we have seen in the cyclical variables – the exchange rate, the labour market and interest rates – will help create the environment that leads to increased investment. But there are clearly limits here. A low exchange rate, low growth in wages and low interest rates are not the basis for sustained increases in investment and output. They can certainly help during the adjustment phase, but ultimately we will be better off if increased investment is driven by high expected returns rather than by the low cost of finance or low wages. This is why the focus on improving the climate for business investment is so important. There is no magic bullet here, but surely the investment climate would be improved through a strong focus by both business and government on innovation, productivity, human capital and entrepreneurship, topics that I have spoken about on previous occasions.
Thank you and I would be happy to answer any questions that you might have.



Add a Comment
We encourage you to use comments to engage with other users, share your perspective and ask questions of authors and each other. However, in order to maintain the high level of discourse we’ve all come to value and expect, please keep the following criteria in mind:
Enrich the conversation, don’t trash it.
Stay focused and on track. Only post material that’s relevant to the topic being discussed.
Be respectful. Even negative opinions can be framed positively and diplomatically. Avoid profanity, slander or personal attacks directed at an author or another user. Racism, sexism and other forms of discrimination will not be tolerated.
Perpetrators of spam or abuse will be deleted from the site and prohibited from future registration at Investing.com’s discretion.