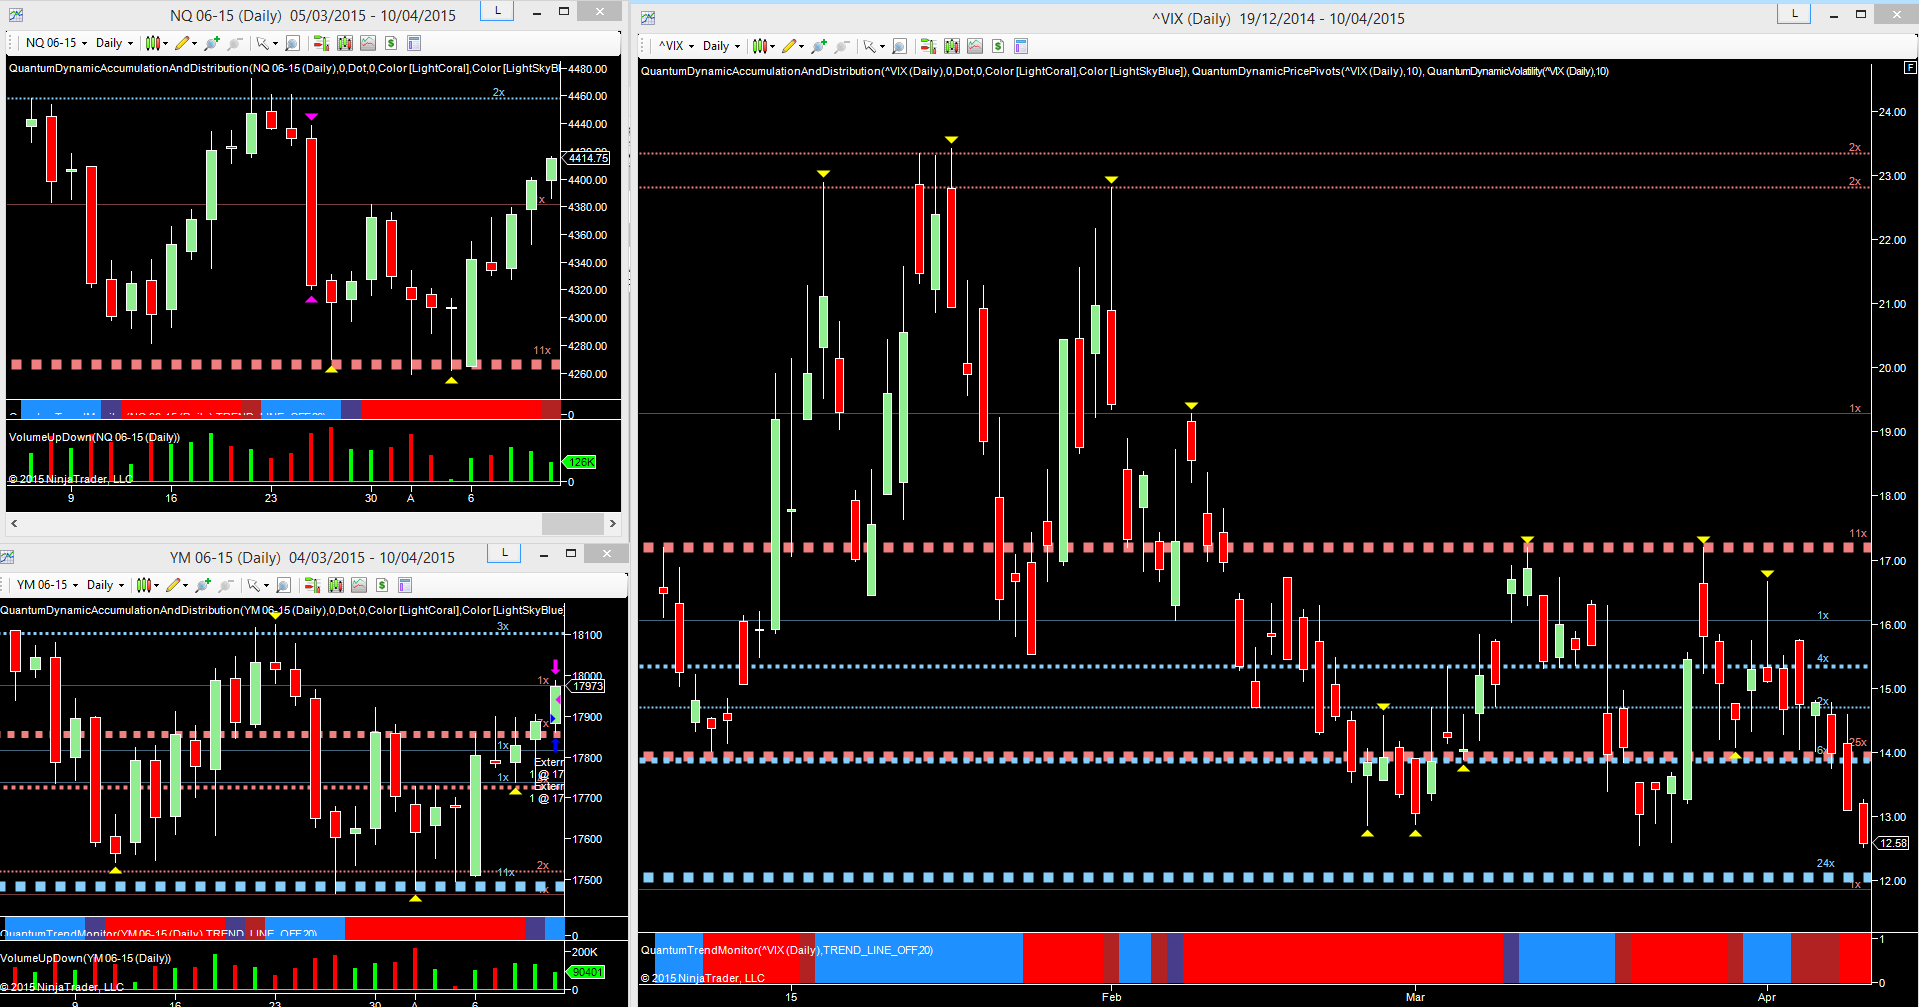
US equities closed last week’s trading session in a bullish mood once again, with all three of the primary indices exhibiting almost identical price and volume profiles, and with the VIX also confirming the current sentiment.
The move high on Friday was once again a repeat of the price action on Thursday, which saw the initial fall at the open of the physical market promptly reverse during the remainder of the session. Thursday’s candles for both the NQ and the YM closed with deep wicks to the lower body, sending a clear signal of bullish intent, which was duly delivered in Friday’s price action. Once again, the open was marked with volatile price action driven by insider stop hunting, before the market was taken higher once again. For the YM emini it was the deep resistance area at 17,860 which was key. Having been breached on Thursday, this then held firm on Friday and provided the requisite platform of support for the move higher.
Longer term, all the major US indices remain range-bound with the NQ Emini moving between the solid platform at 4260 and the less well developed resistance in the 4460 region. For the YM, the well developed platforms of support in the 17,500 and 17,850 are now firmly established, with resistance in the 18,100 now increasingly well defined. A potentially worrying sign on both charts is the price and volume, with both indices rising on falling volume as we move back to test the highs of February and March once again, and suggesting a possible repeat of the last few weeks. Therefore, any breakout into new high ground will need to be accompanied by rising volumes for such a move to be authentic and sustainable.
Finally, moving to the chart of the VIX (on the right), last week was significant with the index moving through the solid platform of support in the 14.00 to close the week at 12.58. Ahead lies the next potential level of support in the 12.00 region, as shown in blue by the accumulation and distribution indicator, and should this be breached, then 11.50 becomes the next logical target which will no doubt reflect US indices testing their own areas of resistance prior to any breakout and continuation of the bullish trend.
