Get 40% Off
⚠ Earnings Alert! Which stocks are poised to surge?
See the stocks on our ProPicks radar. These strategies gained 19.7% year-to-date.
Unlock full list

S&P 500 Plunge? Not (Always) Terrible

Published 01/28/2015, 06:02 AM
Updated 07/09/2023, 06:31 AM

The stock market crashed; it collapsed; it tanked. Or as MarketWatch.com described yesterday’s 1.34% decline: “S&P 500 plunges from major resistance.” Oh, my… that sounds serious. But before we dig a bunker, let’s put yesterday’s price action into perspective. Was the slide unusual? Well, maybe, although “unusual” depends on your expectations for volatility. What does that mean? Depends on who’s speaking. But no worries. A quick tour of market stats will (hopefully) clear up the ambiguity.

Let’s start with the incidence of daily declines of 1.34% or more. Crunching the numbers shows that the S&P 500 has suffered daily setbacks of yesterday’s magnitude (or worse) around 5.9% of the time since 1950. Over the past 10 years, daily downturns of 1.34%-plus have pinched Mr. Market just slightly less than 9% of the time.

Using history as a guide, we’re well advised to expect daily market moves that fluctuate between a daily 2% loss and a 2% gain as a routine affair. Charting the last 1,000 trading days for the S&P 500, for instance, reminds us that changes within this band are as unusual as finding gum on New York sidewalks.S&P 500 Daily % Changes
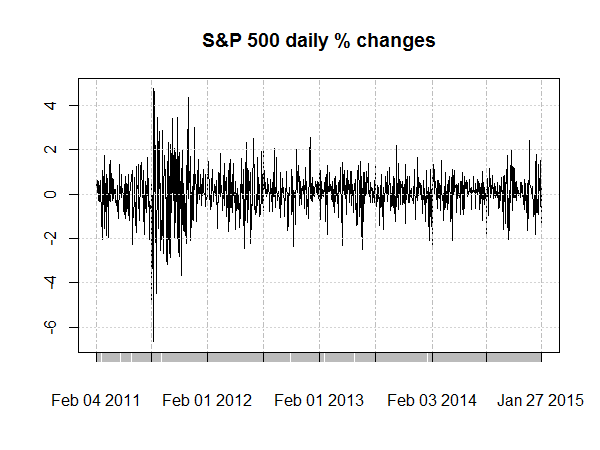
Sure, yesterday’s drop could be the start of something ominous, but it could just as easily turn out to be Mr. Market’s sound and fury that signifies nothing. Don’t misunderstand: price trends are important and worthy of close attention. But unless your trading horizon is the next 20 minutes, daily data in isolation is usually random noise.

One more chart drives home this point. Comparing actual daily returns since 1950 (black circles in chart below) with a random distribution (red line) reveals that the bulk of the changes within the +/-2% band look like noise. It’s at the extremes that daily performance becomes something other than random–i.e., the black dots move far away from the red line, aka fat tails.
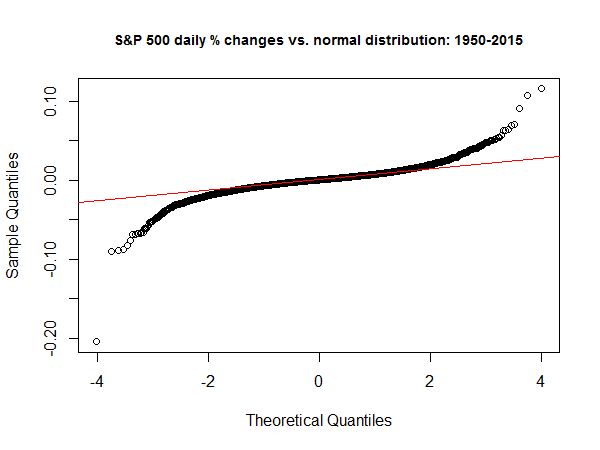
S&P 500 Daily Changes vs. Normal Distribution From 1950-Present

This profile of market history doesn’t offer much in the way of sexy headlines, but sometimes it’s useful to focus on the cold, hard facts vs. the drama… if only as a brief diversion from the crowd’s regular obsessions.

Latest comments

Risk Disclosure: Trading in financial instruments and/or cryptocurrencies involves high risks including the risk of losing some, or all, of your investment amount, and may not be suitable for all investors. Prices of cryptocurrencies are extremely volatile and may be affected by external factors such as financial, regulatory or political events. Trading on margin increases the financial risks.
Before deciding to trade in financial instrument or cryptocurrencies you should be fully informed of the risks and costs associated with trading the financial markets, carefully consider your investment objectives, level of experience, and risk appetite, and seek professional advice where needed.
Fusion Media would like to remind you that the data contained in this website is not necessarily real-time nor accurate. The data and prices on the website are not necessarily provided by any market or exchange, but may be provided by market makers, and so prices may not be accurate and may differ from the actual price at any given market, meaning prices are indicative and not appropriate for trading purposes. Fusion Media and any provider of the data contained in this website will not accept liability for any loss or damage as a result of your trading, or your reliance on the information contained within this website.
It is prohibited to use, store, reproduce, display, modify, transmit or distribute the data contained in this website without the explicit prior written permission of Fusion Media and/or the data provider. All intellectual property rights are reserved by the providers and/or the exchange providing the data contained in this website.
Fusion Media may be compensated by the advertisers that appear on the website, based on your interaction with the advertisements or advertisers.
© 2007-2024 - Fusion Media Limited. All Rights Reserved.