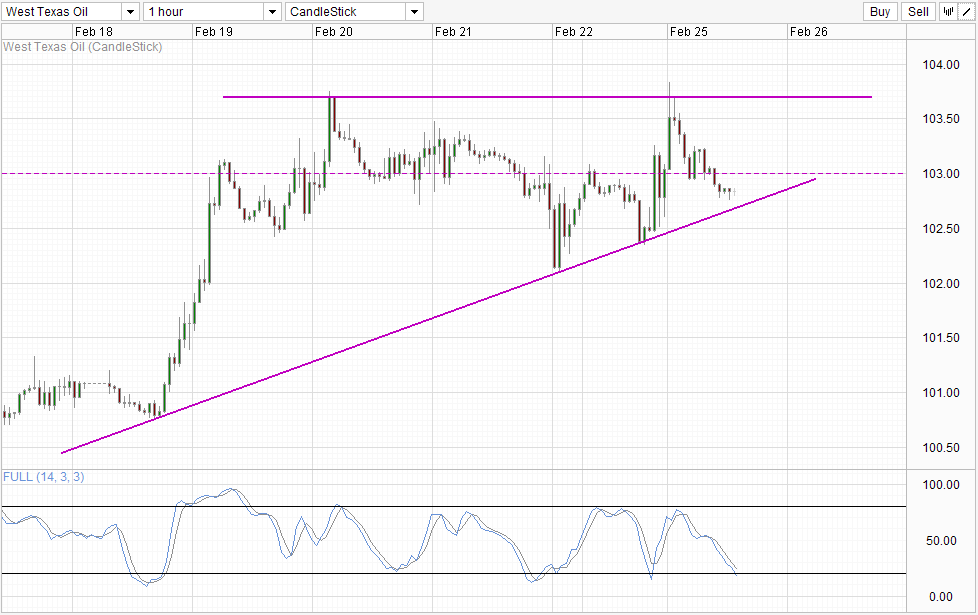
Crude Oil enjoyed a strong rally yesterday, as risk appetite was broadly positive during the US session which saw stocks enjoying one of the strongest day in 2 weeks. However, the rally was short-lived, with prices falling quickly back below the 103.0 support level. This is not really the fault of WTI, as broad risk trends were retracing much of their earlier gains during the New York afternoon as well and it is natural that WTI—which was lifted by risk trends previously—followed the decline.
That being said, there are still signs of weakness for WTI Crude. Yesterday's rally barely cleared the swing high seen on the 20th of February, while stocks managed to break away from last week's ceiling. More importantly, stock prices managed to stay above previous resistance, unlike Crude Oil which is trading below the floor of last Thursday/Friday's trade. Also, while stocks ignored the bearish economic numbers that were released during the early part of the US session, the same cannot be said about WTI, since prices did not have a smooth upward trajectory, unlike Stocks.
Traders may argue that the reason for the less than straightforward rally in WTI yesterday can be attributed to the fact that 103.0 resistance provided a much more difficult task for price to move higher, but this doesn't change the bearish label we're giving WTI as we're trading below 103.0 once again - and any potential rally moving forward will likely face significant resistance once again.
Hourly Chart
It's not all doom and gloom for bulls though. Price is currently approaching the rising trend line which is expected to provide support. Even if the trend line is broken, we should still be able to see significant support from the 102.5 round figure, stretching all the way to last Friday's swing low. Given that Stochastic readings are currently within the Oversold region, the likelihood of prices collapsing from here on out is lower. Should broad risk appetite start to enter once more we should be able to see WTI prices climb or at the very least stay flat in the future.
Daily Chart
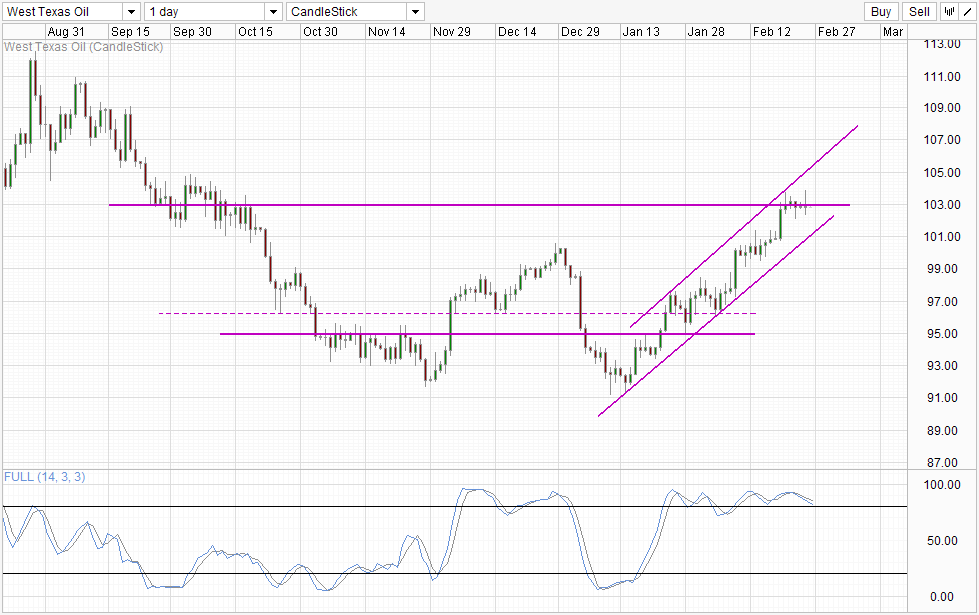
The Daily chart does not give us any new insight either as we remain close to the 103.0 level. Bullish momentum remains intact even though the likelihood of a price top being in place is possible and perhaps even more likely given that a short-term correction scenario is opened with the rebound off the Channel Top and seeking the Channel Bottom. However, with price sticking close to 103.0 for the past 4 trading days it is hard to draw a conclusion on directionality.
Fundamentally, we need to be aware that downside risk for the broad risk trend is increasing as well. Till now we've not seen any significant pullbacks in Stocks after an extended rally in 2013. Also, analysts have been expecting stock prices to fall in the month of February, but price has actually gained strongly despite no major positive economic news releases in the month of February that can justify this rally. As such, it is reasonable to say that the market has been too optimistic as a whole. Should risk appetite disintegrate, Crude Oil—which is showing relative weakness—is likely to suffer even more.


