It is essential to bring back inflation to target European Central Bank President Mario Draghi stressed on Friday the importance to bring inflation back to target without delays as fast as possible. The ECB Chief sent a strong signal that the Bank is ready to broaden the channels through which it intervenes by altering the size, pace and composition of their purchases, if its current policy is not effective enough or further risks to the inflation outlook materialize. Even though much of his speech echoed comments that he made at the latest ECB press conference, the most significant remark in Friday’s speech was that the inflation situation in the Eurozone has become “increasingly challenging”. The urgency he signaled in getting inflation higher, shot up market expectations for aggressive easing measures and pushed EUR/USD down to end the week below 1.2400 (see technical below). Meanwhile, the ECB announced that it has started buying asset-backed securities on Friday, in order to encourage lending and revive the economy.
Elsewhere, the People’s Bank of China cut unexpectedly its benchmark lending rate on Friday for the first time in more than two years, to address the slowing domestic and global economy. The AUD and NZD that heavily depend on trade with China, surged at the news and remained supported during the Asian trading session. If China’s central bank follows up with a cut to reserve requirement ratio, this would loosen further monetary conditions by pushing liquidity into the market and by pushing the commodity currencies further up.
Today’s activity: The main event will be the German Ifo survey for November. All three indices are expected to have remained unchanged or declined. Following the unexpected surge in ZEW survey earlier this month, I believe that Ifo survey could exceed the forecast as well. This could strengthen the euro a bit as it will indicate that the bloc’s growth engine is gaining momentum again. Moreover, the ECB is expected to announce its covered-bond purchases.
In the US, we get the preliminary Markit service-sector and composite PMI for November, Chicago Fed National activity index for October and Dallas Fed manufacturing activity index for November are also coming out.
As for the speakers, the ECB Governing council member Ewald Nowotny speaks at Austrian central bank conference.
As for the rest of the week, on Tuesday, the Bank of Japan releases the minutes from its Oct. 31st policy meeting where the board voted 5-4 to expand monetary policy easing. The minutes will reveal, why the 4 members initially opposed to further stimulus. In New Zealand 2-year inflation expectation for Q4 is coming out. Following the decline in Q3 CPI to New Zealand’s central bank lowest boundary, the possibility for the Q4 expectations to fall are high, which could weigh on NZD. In Germany, the final Q3 GDP data are expected to confirm the preliminary growth figure. In the US, the 2nd estimate of the Q3 GDP is expected to show that the US economy expanded at a slower pace than initially estimated.
On Wednesday, UK’s preliminary Q3 GDP is expected to grow 0.7% qoq, unchanged in pace from Q2. Following the recent weak data and the downward revisions in the latest inflation report, market expectations for BoE tightening have been pushed back, with the timing for the first rate hike now slipping after the general elections in May. A weak growth, could push the rate hike expectations even further back. In the US, we get durable goods for October and personal income and spending for the same month. Personal spending is forecast to have rebounded, fueled probably by income gains amid a stronger US labor market. Core PCE for October is also coming out and it is expected to remain unchanged in pace from September.
On Thursday, the main event will be the German CPI for November. As usual the drama will start several hours earlier when the CPI for Saxony is released ahead of the country’s headline CPI.
Finally on Friday, we have the usual end-of-month data dump from Japan. Eurozone’s unemployment rate for October is also coming out along with the bloc’s CPI estimate for November. With less than a week before the ECB meeting, the ease in the CPI rate is expected to confirm the ECB President Draghi’s concerns that a stronger recovery is unlikely in the coming months and that the Bank should bring inflation back to target without delays as fast as possible.
The Market
EUR/USD falls on Draghi’s comments
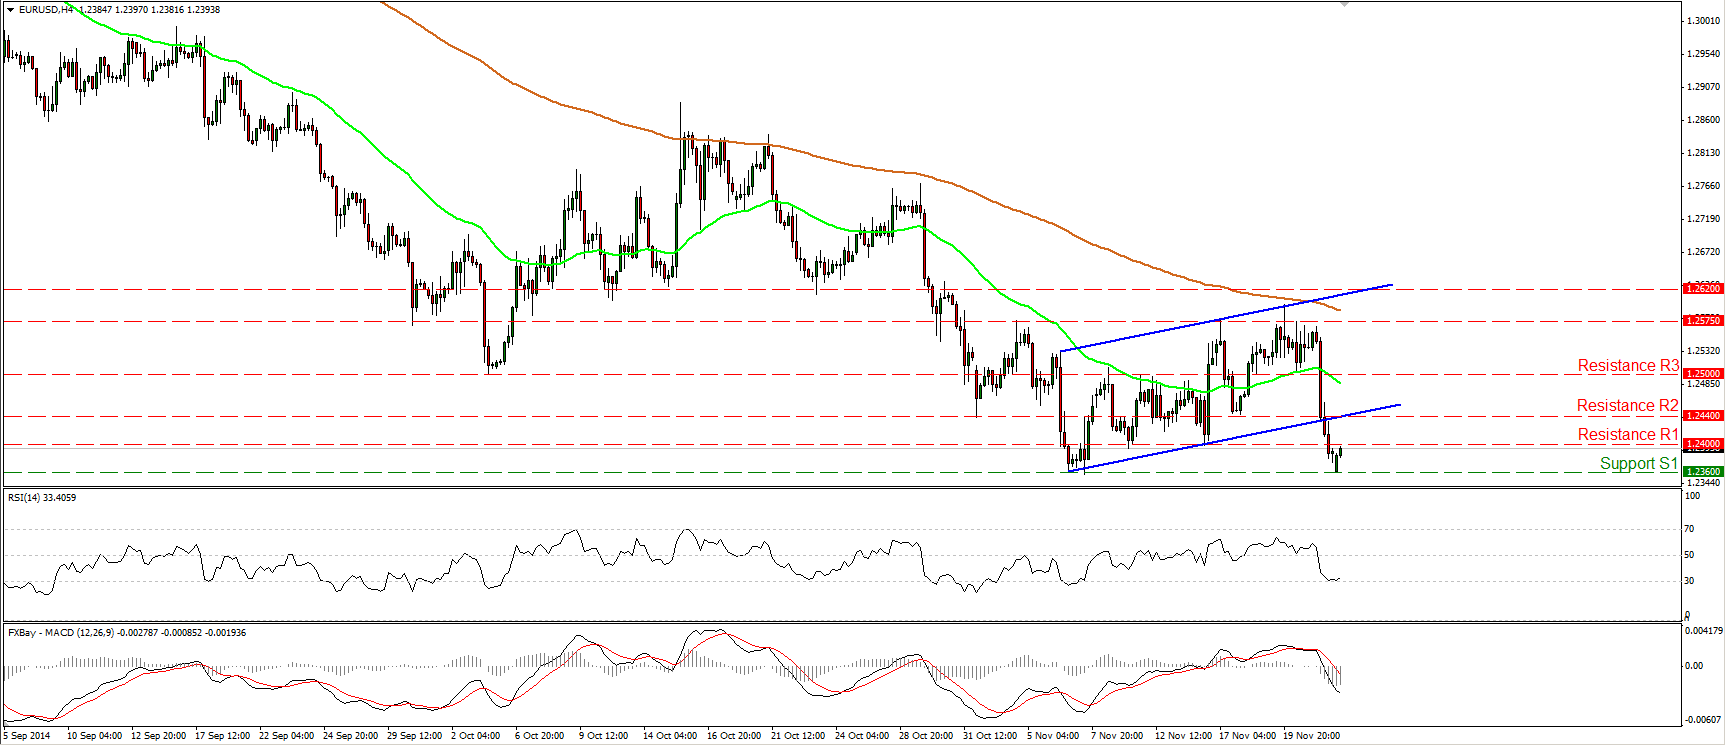
EUR/USD collapsed on Friday after ECB President Mario Draghi said that officials will do what they must to raise inflation, leaving the door open for more drastic measures. The pair violated two support barriers in a row to find support at the 1.2360 (S1) hurdle, defined by the lows of the 6th and 7th of November, before rebounding somewhat. A clear move below that obstacle would confirm a forthcoming lower low on the daily chart and perhaps open the way for the 1.2250 (S2) area, marked by the lows of August 2012. Taking a look at our daily momentum studies, I still see positive divergence between them and the price action, something that gives me additional reasons to wait for a decisive dip below 1.2360 (S1) before getting more confident on the downside.
• Support: 1.2360 (S1), 1.2250 (S2), 1.2130 (S3)
• Resistance: 1.2400 (R1), 1.2440 (R2), 1.2500 (R3)
EUR/JPY corrects lower
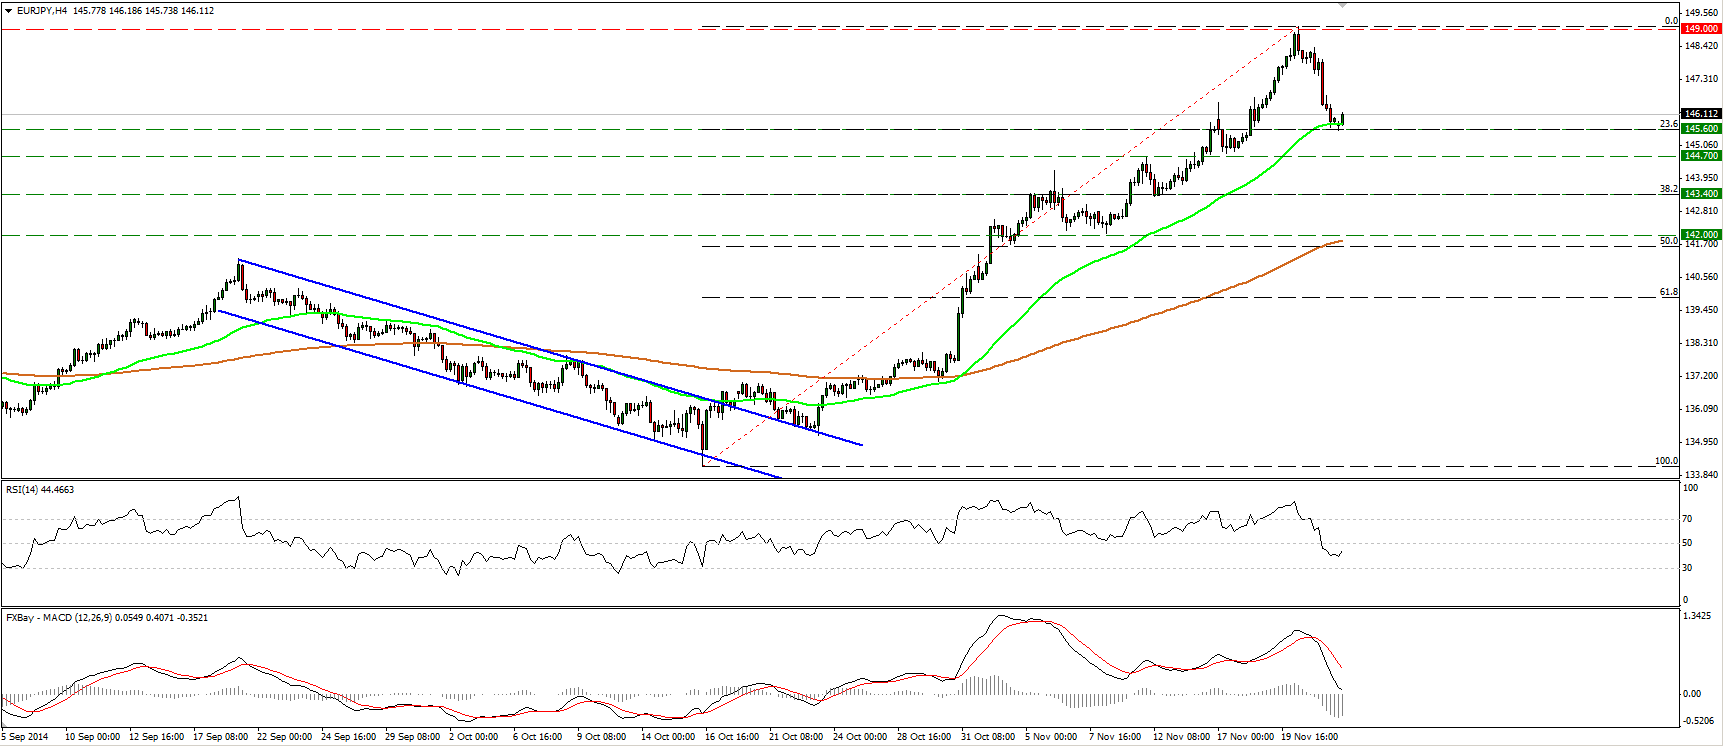
EUR/JPY continued pulling back after forming a shooting star candle pattern on the daily chart. Today, during the Asian morning, the pair found support near the 50-period moving average and the 145.60 (S1) line, which happens to be the 23.6% retracement level of the 16th of October - 20th November up move. Looking at our daily momentum studies, I would stay cautious that the downside retracement may continue. The 14-day RSI moved lower and exited its overbought territory, while the daily MACD shows signs of topping and could move below its signal line in the close future. However, I still believe that the overall trend remains to the upside and I still expect a test at the psychological line of 150.00 (R2) after the correction is over and the bulls manage to take control again.
• Support: 145.60 (S1), 144.70 (S2), 143.40 (S3)
• Resistance: 149.00 (R1), 150.00 (R2), 151.50 (R3)
GBP/USD still within a short-term range
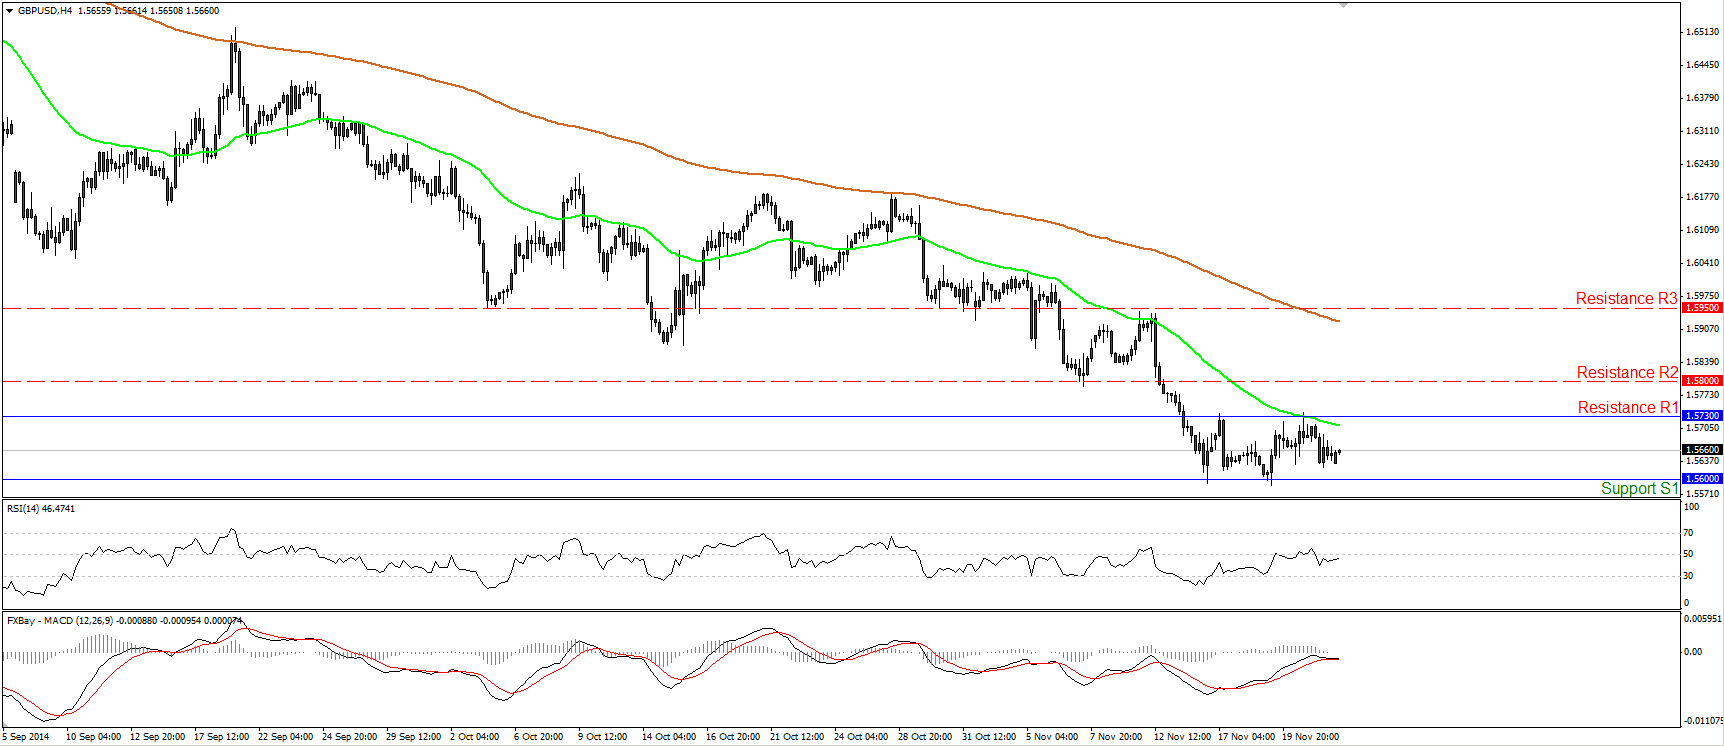
GBP/USD continued trading in a sideways manner, staying between the support line of 1.5600 (S1) and the resistance of 1.5730 (R1). A clear break below the 1.5600 (S1) line is likely to open the way for the psychological barrier of 1.5500 (S2). On the other hand, a move above 1.5730 (R1) could target the 1.5800 (R2) barrier. Both our near-term oscillators lie near their equilibrium levels, confirming the trendless short-term bias of the rate. However, as for the broader trend, I will hold the view that as long as Cable is trading below the 80-day exponential moving average, the overall path remains to the downside.
• Support: 1.5600 (S1), 1.5500 (S2), 1.5430 (S3)
• Resistance: 1.5730 (R1), 1.5800 (R2), 1.5950 (R3)
Gold challenges again the 1205 area
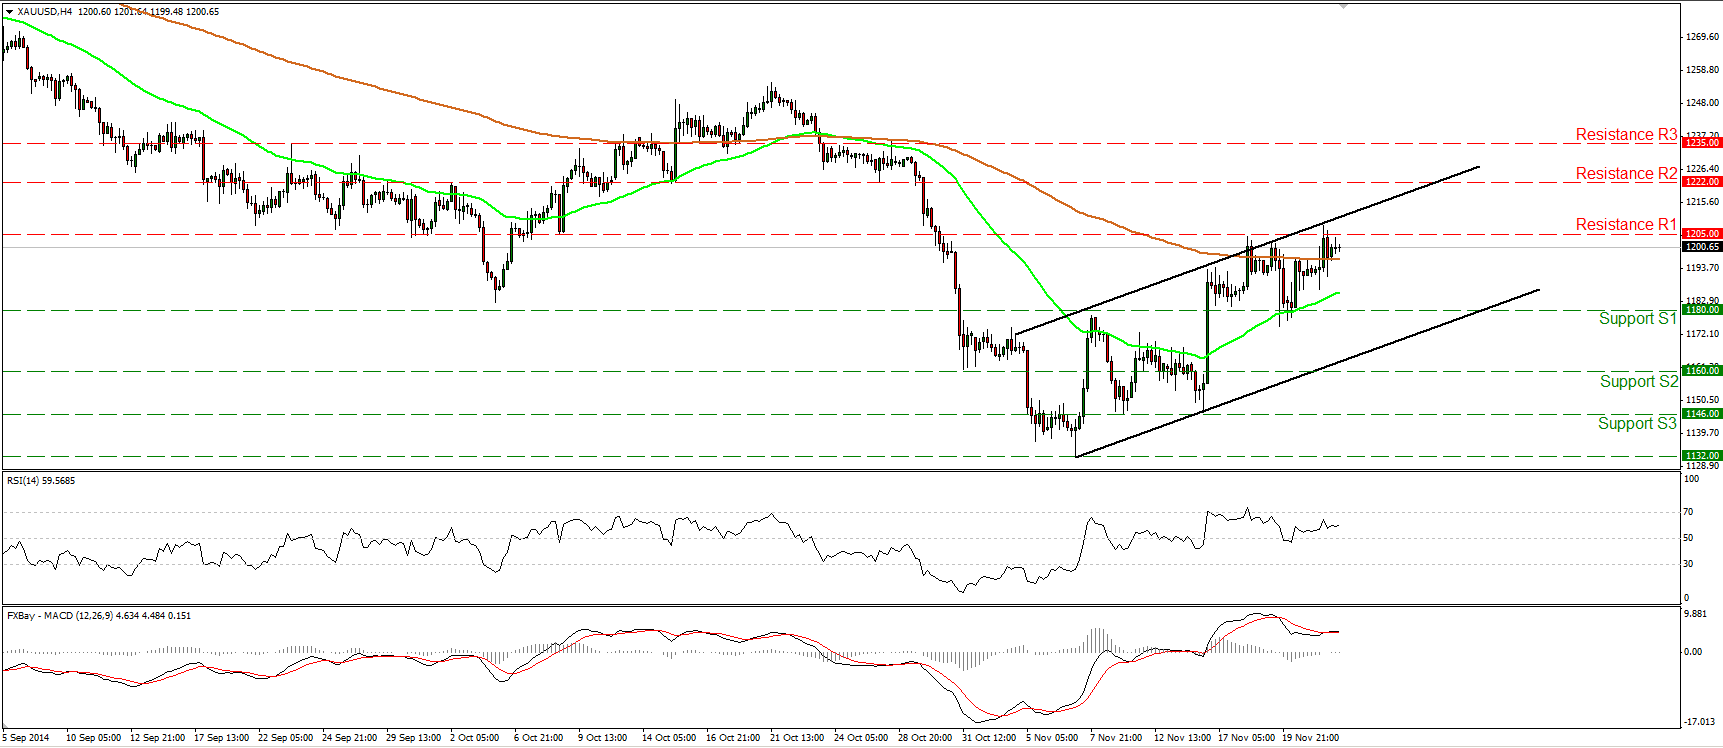
Gold moved slightly higher and challenged once again the 1205 (R1) resistance area and the upper boundary of the black upside channel. As long as the metal is trading within the black upside channel, the near-term bias remains positive in my view. Our daily momentum studies support the notion. The 14-day RSI continued higher and moved above its 50 line, while the daily MACD remains above its trigger, pointing up. However, in the bigger picture, I still see a longer-term downtrend. Hence I would treat the recovery from 1132 as a corrective move for now. In the absence of any major bullish trend reversal signal, I would prefer to adopt a “wait and see” stance as far as the overall outlook of the precious metal is concerned.
• Support: 1180 (S1), 1160 (S2), 1146 (S3)
• Resistance: 1205 (R1), 1222 (R2), 1235 (R3)
WTI continues higher
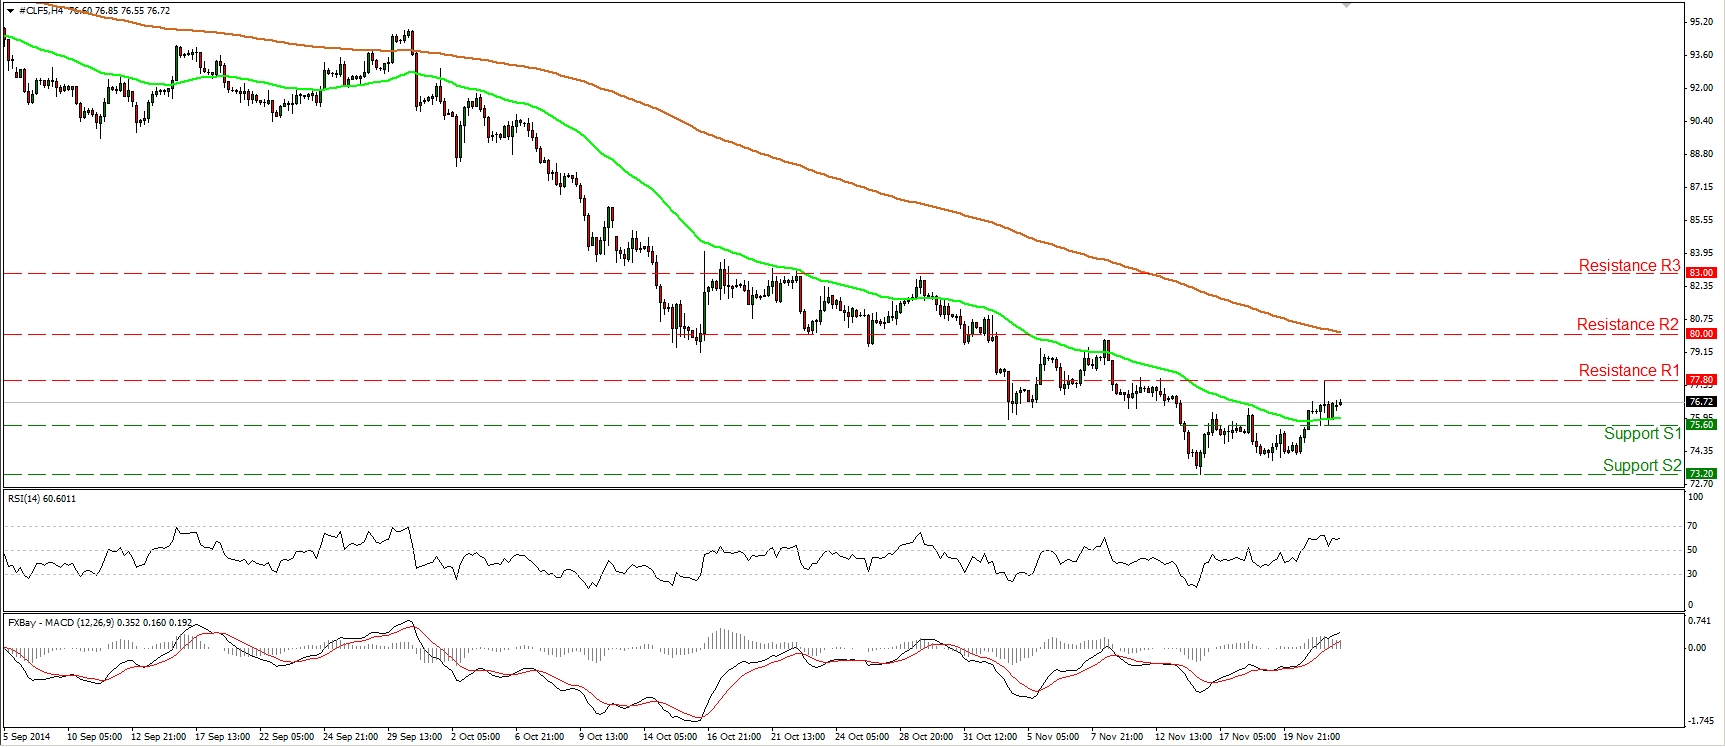
WTI continued it’s up wave on Friday, but it found resistance at 77.80 (R1). I would expect a move above that line to pull the trigger for the psychological number of 80, which now happens to coincide with the 200-period moving average. Our near-term momentum indicators corroborate Friday’s bullish momentum. The RSI edged higher after finding support slightly above its 50 line, while the MACD, already above its trigger, obtained a positive sign. However, on the daily chart, the overall price structure still suggests a downtrend, thus I would consider the current rebound as a corrective phase at the time being.
• Support: 75.60 (S1), 73.20 (S2), 71.00 (S3)
• Resistance: 77.80 (R1), 80.00 (R2), 83.00 (R3)

