I last wrote an update about the MSCI World Market Index earlier this month.
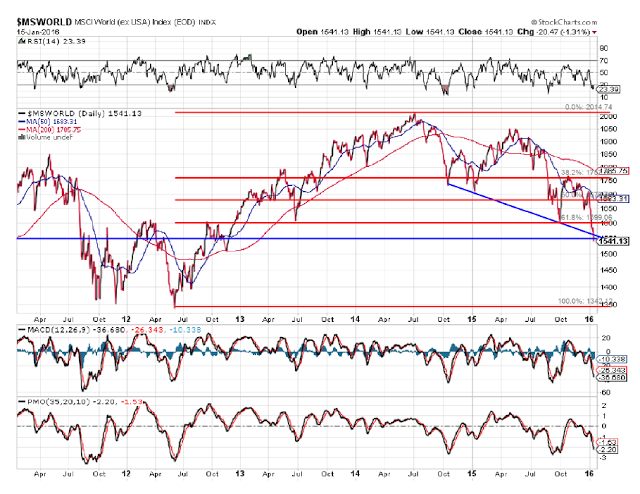
Since then, this index has continued to drop below the critical support level of 1600 and price now sits just below the next support level of 1550.
As you can see from the 5-Year Daily chart below, it's a long way down to major support at 1350. All three indicators point to lower prices...but, the swings are large, and we may see some kind of bounce, although it's not clear as to when or at what level that may occur.
If the U.S. markets are going to lead global markets to some kind of bounce, it's worthwhile monitoring the price action of the SPX and the SPX:VIX ratio, as I discussed in my post of January 15th, for possible clues as to the timing of such a bounce.
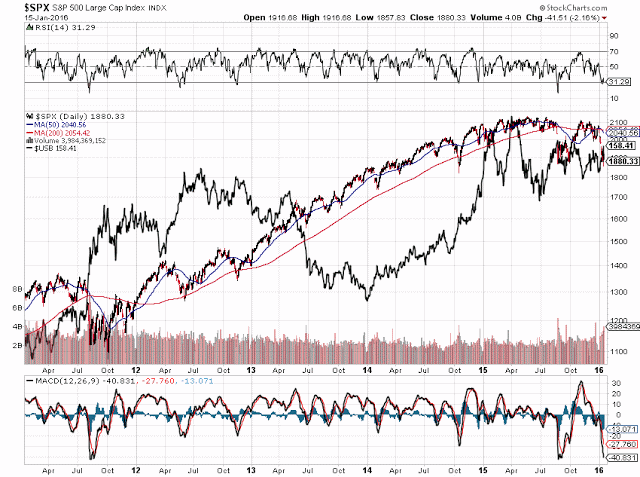
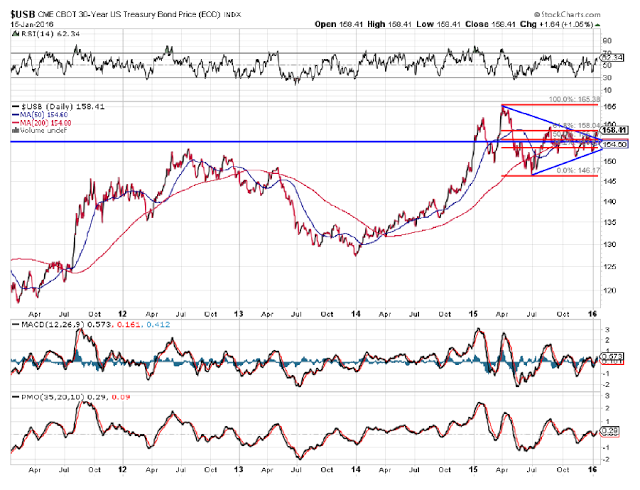
Additionally, you can see from the 5-Year Daily comparison chart below of the SPX and USB (30-year U.S. Bonds) that, at times they traded in opposite directions, but were, more or less, in demand from the beginning of 2014 until January of last year, when they uncoupled once more, and the swings on USB became very volatile. Furthermore, we now see, once again, a bearish Death Cross formation on the SPX, which hints of further downside movement, as do the lower lows on the RSI and MACD indicators. So, let's examine the price action more closely on USB.
The following 5-year Daily chart of USB shows that price has now broken above triangle resistance and major price resistance of 155. While we have new "buy" signals on the MACD and PMO indicators, and the RSI is still rising above the 50 level, we don't quite have a bullish Golden Cross formation yet on the 50 and 200 MAs...although it appears to be imminent. If price can rally and hold above the 60% Fibonacci retracement level around 160, there's a good chance that it will continue...which may, in turn, negatively or positively influence price action on the SPX.
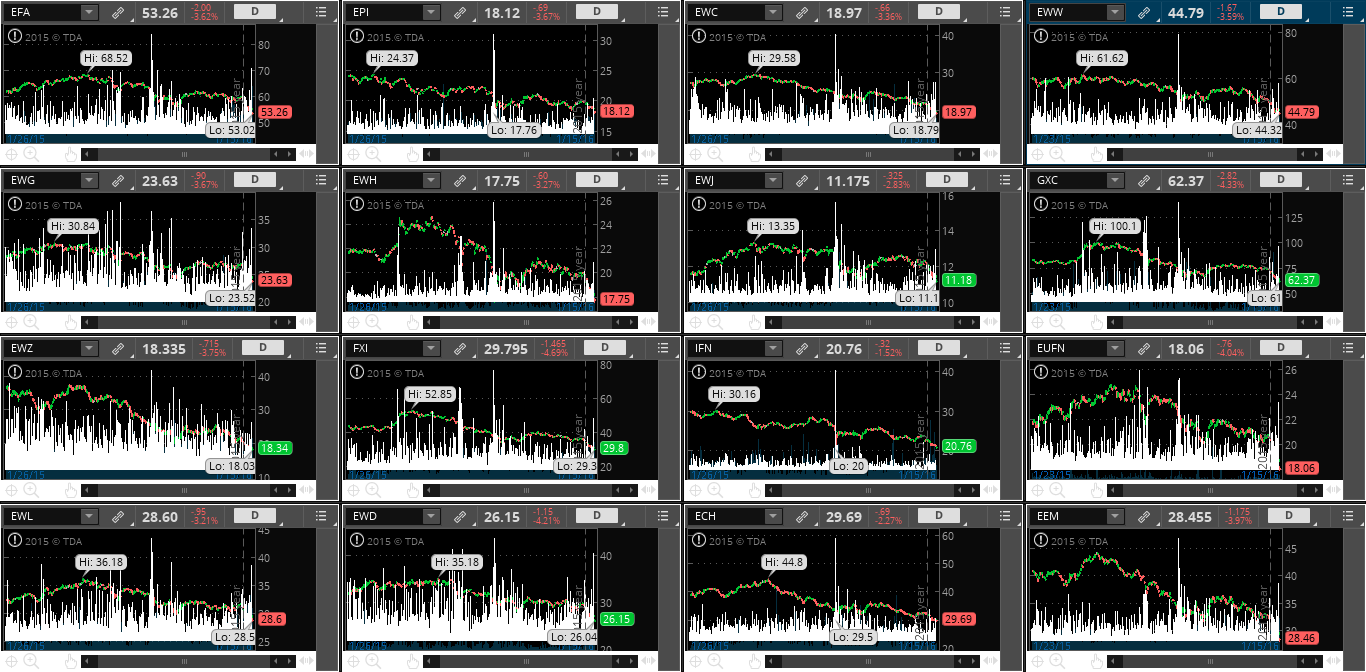
So, have we reached capitulation yet on U.S. equities? As I mentioned in my post of early December, one gauge of market sentiment that I look at from time to time is my chartgrid of Foreign ETFs.
The following 1-Year Daily chartgrid [featuring 12 ETFs: iShares MSCI EAFE (N:EFA), WisdomTree India Earnings (N:EPI), iShares MSCI Canada (N:EWC), iShares MSCI Mexico Capped (N:EWW), iShares MSCI Germany (N:EWG), iShares MSCI Hong Kong (N:EWH), iShares MSCI Japan (N:EWJ), SPDR S&P China (N:GXC), iShares MSCI Brazil Capped (N:EWZ), iShares China Large-Cap (N:FXI), India Fund (N:IFN), iShares MSCI Europe Financials (O:EUFN), iShares MSCI Switzerland Capped (N:EWL), iShares MSCI Sweden (N:EWD), iShares MSCI Chile Capped (N:ECH), iShares MSCI Emerging Markets (N:EEM)] shows the ATR on each ETF (the white histogram at the bottom of each ETF)...an extreme high ATR can often signal capitulation and a reversal of a recent general trend. Approximately one-half of them have put in an extreme, or near-extreme, ATR reading, which may indicate a possible slowing of the recent plunge in equities.
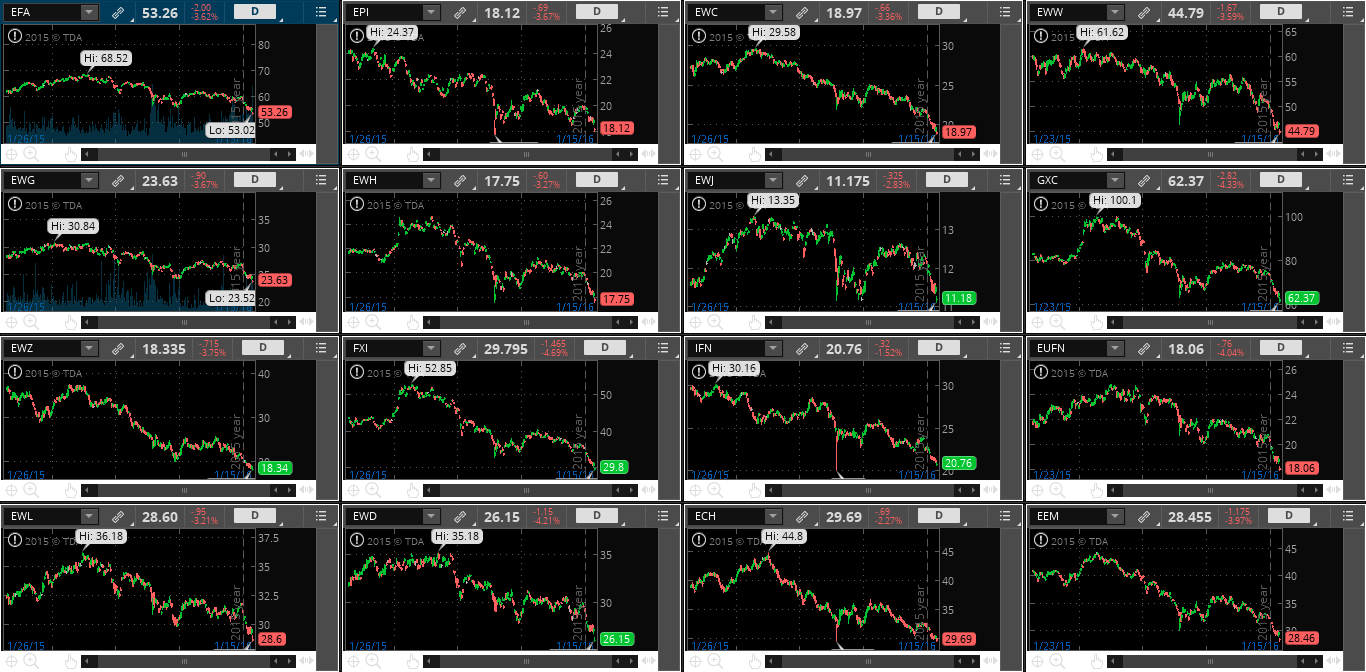
The next 1-Year Daily chartgrid shows that all of these ETFs are in downtrend, most of which have made a new low recently during this one-year period.
CONCLUSIONS:
While the above information tells me that the plunge in world equity markets may be slowing, or will slow down sometime soon, we may see further selling continue (while investment continues in U.S. Bonds) until very extreme price, volume, and ATR levels are reached.
These charts are worth monitoring over the coming days/weeks for signs of any such capitulation and/or reversal.
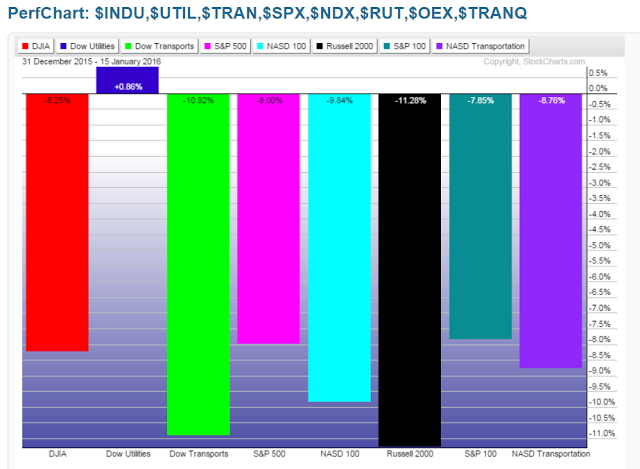
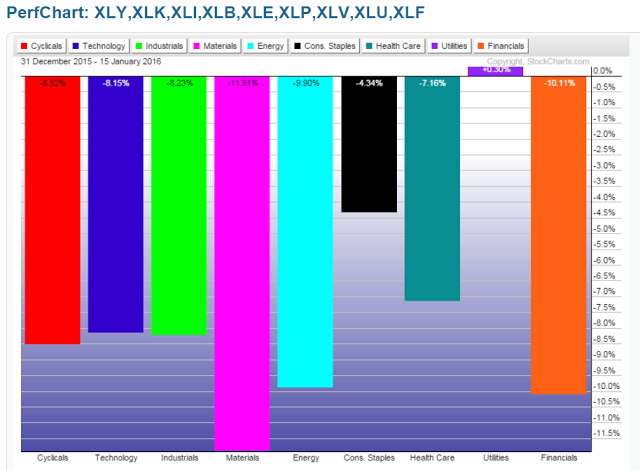
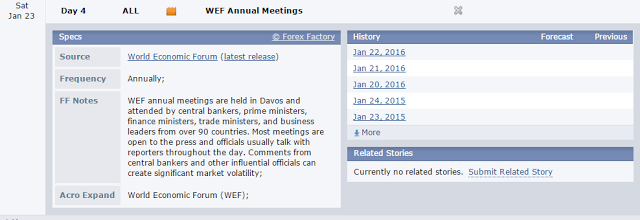
Furthermore, one important world economic event to note is the upcoming 4-day WEF Annual Meeting. It concludes on Saturday, January 23rd. Any possible decisions coming from that meeting may influence world markets, either positively or negatively, and may provide a catalyst for a capitulation, as may the results of the next 2-day meeting of the FOMC on Wednesday, January 27th. By then, we're approaching the end of the first month of 2016, which may try to end on a positive note and erase the considerable losses that we see, thus far, on the following Year-to-Date graphs of the U.S. Major Indices and its 9 Major Sectors.
Source: ForexFactory. com
