
Yahoo Inc. (YHOO) is set to release its Q3 earnings on October 15, 2013.
Last quarter, Yahoo (YHOO) reported a 15.38% positive surprise in regard to Wall Street estimates. But was the $.31 per share Wall Street estimate what the market really expected? Revenue has declined since Q4 of 2012, and has been relatively unchanged for the past two quarters. Despite stagnant revenue growth, the stock hit a new 5-year high in late September.
Last quarter Yahoo posted GAAP revenue’s of 1.14 Billion. This was down both sequentially and year over year. Expense Management widened margins from the previous year’s second quarter.
With Marissa Mayer at the helm, Yahoo has continued to grow its share price in spite of revenue remaining relatively unchanged. This leaves investor’s wondering if Mayer is brilliant, lucky, or overrated. Yahoo’s 25% stake in Alibaba was the product of previous CEO Jerry Yang, and has contributed to the major growth of the stock price. Alibaba has been recently rumored for an upcoming IPO, and share price is being adjusted accordingly. So if revenue is not growing, why is the share price continuing to rise? If Yahoo could beat expectations this quarter, would this be a double positive for the company? We think so, and using the Estimize Expectation would be a much more conservative mark to be beaten.
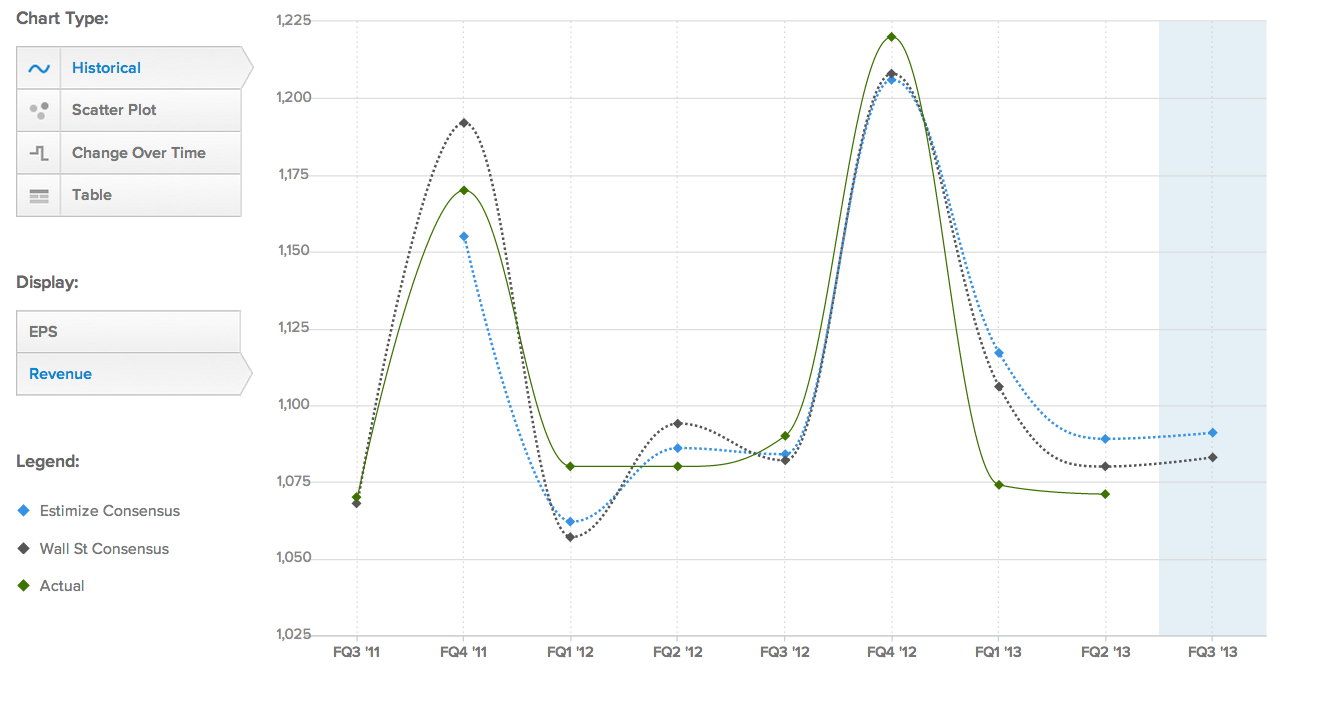
Estimize EPS estimates come in slightly above the Wall Street consensus at $.36 per share versus $.33 per share. Revenues also reflect the buy side expectation at $1,089(M) versus the Wall Street expectation of $1,080(M).
So what do these numbers tell us? One, we expect Yahoo to once again beat both Estimize and Wall Street EPS expectations. The company has beaten both sets of estimates each of the past 8 quarters. What really matters is how the market will respond to these results. Just last quarter, the 15.38% positive surprise resulted in a share price jump of $2.78 per share at the close of the following day. Two quarters ago, a positive surprise and beat on EPS resulted in a $.48 increase in share price 5 days after reported results.
The EPS and REV estimates are backed up by data from the most accurate analysts from Yahoo’s previous quarter. Aaron Jackson, the second most accurate analyst from Q2, predicts EPS of $.37 per share and REV of $1,088(M). Here is the distribution of estimates from all of our analysts.
The recent acquisition of TUMBLR for over $1,000(M) has investors speculating about margins. Expense trimming weighs in the opposing opinion as bullish investors expect margins to increase once again. Overall opinions of Marissa Mayer see her as able to cut expenses while maintaining production for Yahoo, the 5th largest company in the Internet Information Provider Industry.
- English (UK)
- English (India)
- English (Canada)
- English (Australia)
- English (South Africa)
- English (Philippines)
- English (Nigeria)
- Deutsch
- Español (España)
- Español (México)
- Français
- Italiano
- Nederlands
- Português (Portugal)
- Polski
- Português (Brasil)
- Русский
- Türkçe
- العربية
- Ελληνικά
- Svenska
- Suomi
- עברית
- 日本語
- 한국어
- 简体中文
- 繁體中文
- Bahasa Indonesia
- Bahasa Melayu
- ไทย
- Tiếng Việt
- हिंदी
Will Yahoo Beat Expectations From Hedge Fund Analysts?
Published 10/14/2013, 01:30 AM
Updated 07/09/2023, 06:31 AM
Will Yahoo Beat Expectations From Hedge Fund Analysts?


Latest comments
Install Our App
Risk Disclosure: Trading in financial instruments and/or cryptocurrencies involves high risks including the risk of losing some, or all, of your investment amount, and may not be suitable for all investors. Prices of cryptocurrencies are extremely volatile and may be affected by external factors such as financial, regulatory or political events. Trading on margin increases the financial risks.
Before deciding to trade in financial instrument or cryptocurrencies you should be fully informed of the risks and costs associated with trading the financial markets, carefully consider your investment objectives, level of experience, and risk appetite, and seek professional advice where needed.
Fusion Media would like to remind you that the data contained in this website is not necessarily real-time nor accurate. The data and prices on the website are not necessarily provided by any market or exchange, but may be provided by market makers, and so prices may not be accurate and may differ from the actual price at any given market, meaning prices are indicative and not appropriate for trading purposes. Fusion Media and any provider of the data contained in this website will not accept liability for any loss or damage as a result of your trading, or your reliance on the information contained within this website.
It is prohibited to use, store, reproduce, display, modify, transmit or distribute the data contained in this website without the explicit prior written permission of Fusion Media and/or the data provider. All intellectual property rights are reserved by the providers and/or the exchange providing the data contained in this website.
Fusion Media may be compensated by the advertisers that appear on the website, based on your interaction with the advertisements or advertisers.
© 2007-2024 - Fusion Media Limited. All Rights Reserved.