The markets are in celebration mode. The Dow Jones Industrials, S&P 500 and Russell 2000 are all at record highs. The NASDAQ gets a pass after having to recover from a mania fueled spike in 2000, but even that is nearly at an all-time high. But one index is lagging the rest. The Dow Jones Transportation Index.
It certainly isn’t because it has run out of gas. Fuel is more plentiful and cheaper that it has been for a long time. But many say that it is part of the problem. Railroads have evolved to transporting a lot of oil and with prices lower there is less production, or so the story goes. What may be lost is that railroads transport a lot of other stuff too. And so do trucks and airplanes. They should be benefiting from lower fuel costs. But if any of those stories are at play they will work out over time.
What is known today is that the Transports (ARCA:IYT) are lagging the rest of the markets, still below their end of November high. Will they join the rest of the party and move up to a new all-time high Or are they the canary in the coal mine (did I mention they transport a lot of coal too?) telling us that the new highs will not hold? The price action has some clues.

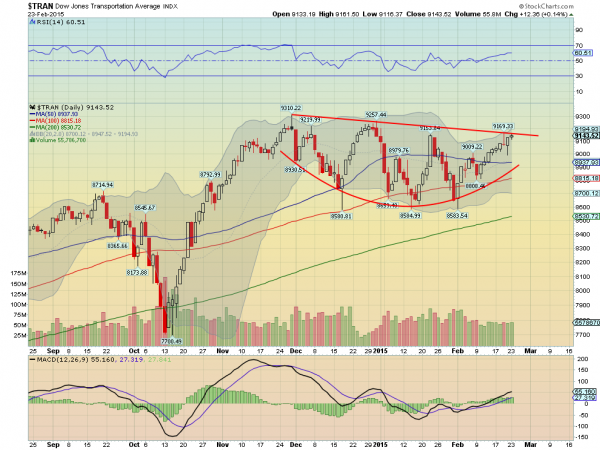
The chart above shows the Transports moved off of the October low to the high of November 28th. After that though it has pulled back ans then moved higher a number of times, but has not made a higher high yet. Instead it has created a falling trend resistance line. At the end of the day Monday the Index was back at that line. At this point there are several other indicators that point to a possible break higher. That could lead to new all-time highs.
The first is the momentum indicator RSI. It is rising and in the bullish zone as the Index hits resistance. But this has been the case the last two times the Index has challenged resistance, only to fail. Next the MACD is also rising, a bullish sign. But like the RSI, this is not the first time the MACD has been bullish at resistance.
The move off of the recent low to start February is a positive. The Index made a higher low and now a higher high. This defines a short term trend higher. This was not the case the last two times. Also notice that the Bollinger Bands® are opening higher, allowing the Index some upside room. This did not happen before either. Finally, there is the rounded bottom against the resistance above. Making lower lows and then higher lows, a bottoming process.
The signals and indicators are lining up for the transports to break out to new all-time highs. Every one of them is on the side lines cheering. the stage is set. Now the Index just has to start moving.
Disclaimer: The information in this blog post represents my own opinions and does not contain a recommendation for any particular security or investment. I or my affiliates may hold positions or other interests in securities mentioned in the Blog, please see my Disclaimer page for my full disclaimer.
