Market Movers: Weekly Technical Outlook
Technical Developments to Watch:
- EUR/USD testing key previous/Fib support at 1.2260 – break below would be bearish
- GBP/USD still finding support at key 1.5600 level
- USD/JPY uptrend intact above 115.50 support
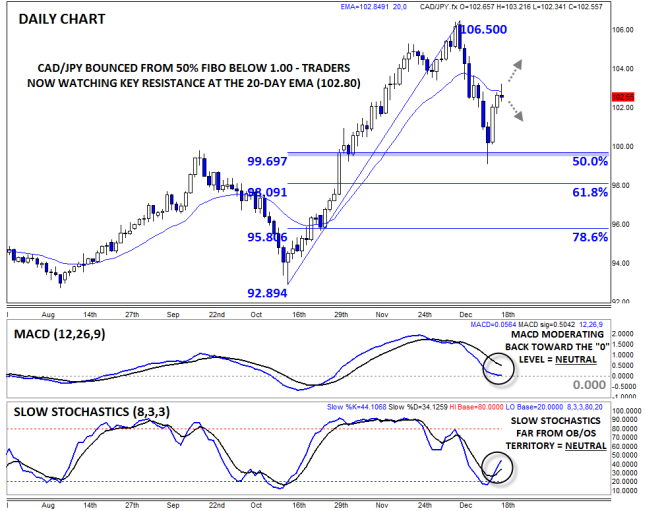
- CAD/JPY in play, all eyes on 20-day EMA resistance at 102.80
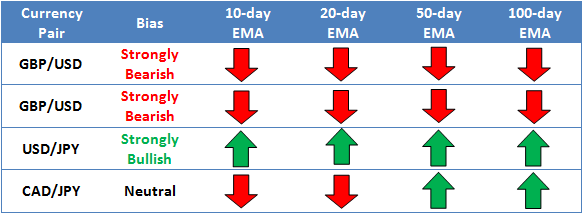
* Bias determined by the relationship between price and various EMAs. The following hierarchy determines bias (numbers represent how many EMAs the price closed the week above): 0 – Strongly Bearish, 1 – Slightly Bearish, 2 – Neutral, 3 – Slightly Bullish, 4 – Strongly Bullish.
** All data and comments in this report as of Friday’s European session close **
EUR/USD

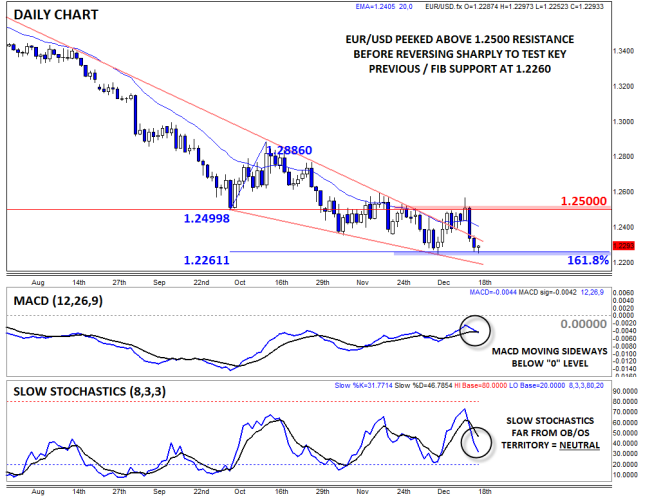
- EUR/USD reversed off previous resistance near 1.2500 last week
- MACD and Slow Stochastics show balanced, two-way trade
- Rates now testing key previous support in the mid-1.22s
Heading into last week, EUR/USD’s chart was beginning to look cautiously bullish, with rates peeking out above the two-month falling wedge pattern. After a continuation higher in the first half of the week though, the pair reversed abruptly in the wake of Wednesday's FOMC statement and press conference. Now, the secondary indicators are clearly neutral, and rates are testing key previous / Fibonacci support in the mid-1.22s. If that floor is broken, a continuation down to 1.2200 or the mid-1.2100s is possible this coming week.
GBP/USD

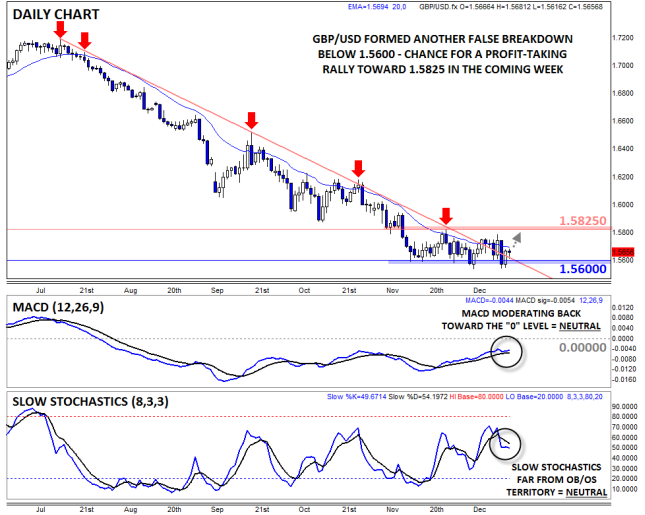
- GBP/USD failed to break down below 1.5600 support again last week
- MACD continues to moderate back toward the “0” level, showing receding bearish momentum
- Chance for a continuation toward the top of the recent range at 1.5825 next
Like its mainland rival, GBPUSD rallied early last week before selling off sharply on the back of Wednesday’s Federal Reserve meeting. Like the previous week, the pair peeked below previous support at 1.5600, but bulls stepped in aggressively to defend that zone once again. The secondary indicators are showing generally balanced, two-way trade, with the MACD moderating back toward the “0” level and the Slow Stochastics far from overbought or oversold territory. Quiet trade is expected this coming week, but a profit-taking bounce toward the top of the recent range at 1.5825 would not be surprising.
USD/JPY

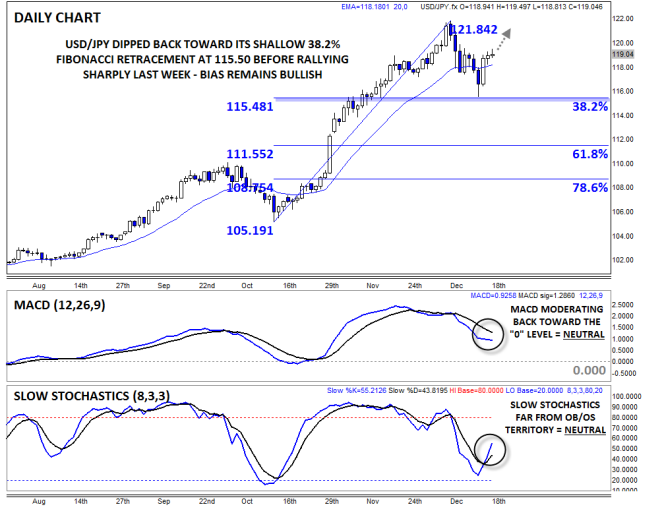
- USD/JPY pulled back to 38.2% Fib support at 115.50 before bouncing to close the week
- MACD rolling over, signaling declining bullish momentum
- Medium-term bias remains to the topside above key support at 115.50
USD/JPY dipped down to a critical support level, the 38.2% Fibonacci retracement at 115.50, last week, but quickly rallied from that floor. As we go to press, the pair has regained its 20-day EMA at 118.15, helped along by the big rally in US equities. The bias is bullish heading into the historically slow late-December holiday period. While the MACD is rolling over back toward the “0” level, we are inclined to give the established uptrend the benefit of the doubt above the 115.50 floor.

- CAD/JPY similarly pulled back before rallying into the end of last week
- Lagging MACD pulling back, but the more timely Slow Stochastics have turned higher
- All eyes on 20-day EMA resistance at 102.80
CADJPY is our currency pair in play due to a number of high-impact economic reports out of Canada and Japan this coming week (see “Data Highlights” below for more). Looking to the chart, the pair pulled back early last week before rallying back to the 20-day EMA by Friday. The lagging MACD indicator continues to pull back to the “0” level, but the more timely Slow Stochastics indicator has already turned higher, suggesting that the longer-term uptrend remains intact for now. For this coming week, all eyes will be on resistance at the 20-day EMA at 102.80: if rates can break above this barrier, a continuation toward 104.00 or higher is likely.
Europe: What to Expect in January 2015
The next few weeks will contain two key events for the currency bloc. First up is the final round of voting in the Greek Presidential election on 29th December. If the government’s candidate for president is rejected, then the parliament in Athens will be dissolved and a general election will be called, most likely for end of January/start of February. This could cause some volatility, particularly in sovereign debt markets, with the left-wing anti-austerity Syriza party currently leading in the polls, this election could once again turn into a referendum on Greece’s position within the currency bloc.
While this is likely to cause volatility in Greece’s sovereign spreads, we think contagion could be limited, not least because Portugal, Ireland, and Spain have strengthened their fundamentals in the past year. Of course, a win for Syriza could cause havoc in peripheral debt markets, so market sentiment towards EUR-based assets may turn cautious at the start of the New Year.
The other thing on everyone’s minds will be what the ECB does at its January meeting, which takes place on 22nd January, as the ECB will move from monthly meetings to meetings every six weeks in 2015. Whether or not they decide to embark on QE could be dependent on the December CPI estimate due on 7th January. The market currently expects inflation to fall to 0%; however after the sharp falls in oil price, the chances are that we could get a sharper drop, potentially to -0.1% or -0.2%. While we continue to believe that the bar to full-scale, Fed-style QE is still very high, not least because of political opposition from Berlin, we believe that the ECB will be compelled to act if the Eurozone falls into outright deflation at the end of this year.
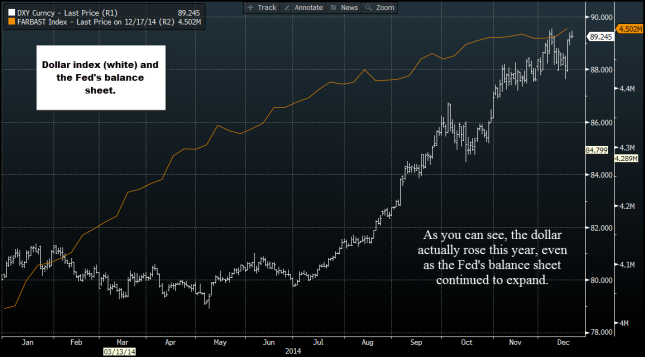
So what would QE do to the EUR? We think that if the ECB does decide to extend its asset purchase program, potentially to include sovereign assets, then the program would not be big enough to push down the EUR in any meaningful way. Added to this, the relationship between QE and FX performance is not clear cut. As you can see in the chart below, the USD has actually rallied this year even though the Fed’s balance sheet has continued to expand. The same could happen with the EUR, as the near 13% fall in EUR/USD since May is, to some extent, the market pricing in the prospect of QE, which can have a more powerful effect on the currency. Although we expect EUR/USD to fall below 1.20 in 2015, we don’t think that it will fall as a result of QE, and deflation and growth fears could have a greater negative impact on the EUR.
As you can see, there is still a lot of risk for the Eurozone, with Greece and deflation the biggest threats to EUR performance in January.
The latest opinion polls suggest that Abe will win a large majority on Sunday, and this appears to be what the market is expecting. However, if Abe is given a mandate to embark on his economic policy program, his recent rhetoric suggests that 2015 will be another year when the Japanese government focuses on the first two arrows of Abenomics: stimulus spending and monetary policy largesse. The third arrow, economic reform, may stay on the back-burner for some time yet.
Is yen sentiment shifting?
As we lead up to the election, the yen has had its best weekly performance in 16 months. The JPY was the top performer among the G10 this past week and is up against all of its G10 peers. It has done particularly well versus the commodity currencies including the NOK (up more than 4%), the CAD (up 2.3%) and the AUD (up 2.2%). The yen is benefiting not only from inflows before the election, but also from the Oil price decline. Since the nuclear disaster in 2011, Japan has been a major oil importer, so a falling oil price is good news for Japan’s terms of trade hence its strong performance versus the commodity bloc of currencies.
The strong oil price may not be the only thing propping up the JPY in the coming weeks. The BOJ may refrain from embarking on more stimulus next year, even if the government feels that more stimulus is needed. Firstly, the BOJ already extended its stimulus program at the end of October. Secondly, the fall in the oil price could boost consumption and spur inflation. With prices already running above the BOJ’s 2% target at 2.2%, there is less pressure for the BOJ to react immediately to any disinflationary impulses coming from the sharp drop in the oil price.
The Tankan index for the fourth quarter, which is released on Monday, is expected to remain steady, with the headline index coming in at 13. Business investment is expected to moderate slightly to 8.1% in Q4, from 8.6% in Q3. This also supports the BOJ remaining on hold as we move through to the New Year, which could help to stabilize the JPY in the coming days and weeks.
However, the outlook for the JPY in the next few days could depend on two factors. We could see the JPY give up some recent gains if PM Abe wins the election as expected and if the Tankan meets expectations. Since the JPY is perceived as a safe haven, it tends to come under pressure on the back of good economic news at home. Selling pressure on the JPY could intensify after the FOMC meeting this week. If the Fed drops its phrase “considerable time” in reference to the next rate rise, then we could see a sharp reversal in USD/JPY, and rising US rates could see this pair climb to prior highs at 121.85 – the high from 8th December.
However, in the longer term, those looking for 140 in USD/JPY by the middle of next year could be a little over optimistic if the BOJ doesn’t embark on more stimulus, no matter what Mr. Abe says.
A Good Year for the Dollar
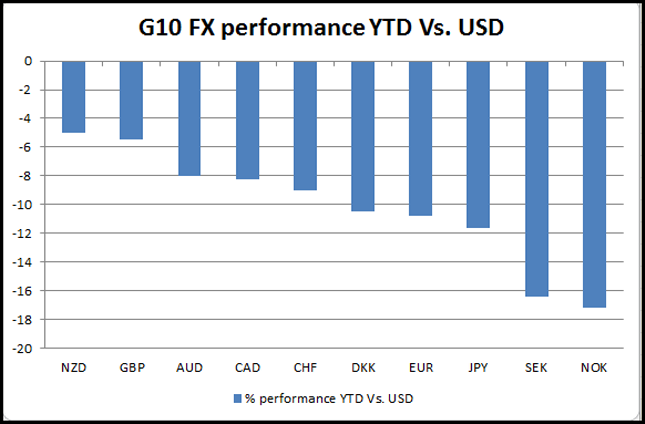
With only a couple of weeks left until the end of the year, it is worth evaluating FX performance this year. As you can see in the chart below, the USD has been a stand-out performer in both the G10 and EM FX spaces. The gains in the buck have also been impressive, highlighting the momentum gained by the buck in recent months.
Looking at the G10 space first, the sharpest sell off has been in the NOK and the SEK. This is partly down to the decline in the oil price, as Norway is a major oil producer in Europe, but it is also down to a re-adjustment in relative interest rate differentials. Although Norway has a substantially higher nominal interest rate than the US, the market punished the NOK because of the central bank’s shift to a dovish stance, culminating in a rate cut earlier this month. The dollar trend is built upon Fed tightening expectations, and central banks that are cutting or erring on the dovish side are seeing a weaker currency vs. the USD, which is a theme that could stretch into 2015.
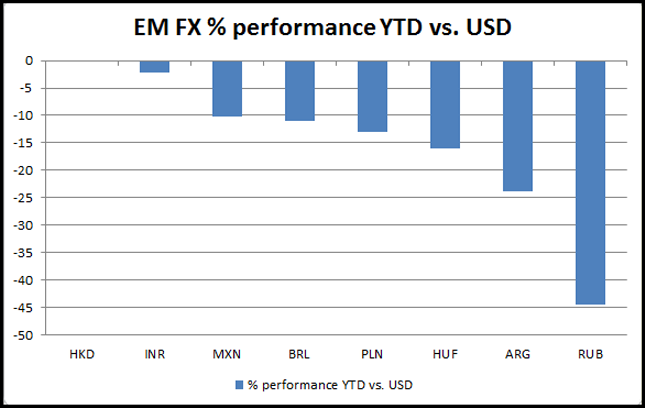
The dollar has also risen against the emerging market FX space. Interestingly, the rupee, which was severely punished in 2013, was one of the more resilient currencies vs. the USD in 2014. This was due to a change in government and a falling oil price that helped to improve India’s trade deficit, as the government subsidizes oil costs for some of its citizens. India’s current account has improved to -1.3% of GDP from -5.38% last year, and the market has rewarded this improvement with a fairly stable INR performance during the dollar rally.
In contrast, the Russia ruble has fallen 40% and has experienced bouts of extreme volatility. Weak economic growth, a sharp decline in oil prices and the severing of diplomatic ties with the West contributed to the sell-off and currency panic last week. As we move towards a new year, Russia still has to contend with these problems and the recent increase in interest rates to 17% could deepen the recession next year. Thus, we could see the dollar further outperform the RUB next year.
Other notable underperformers include the HUF, TRY,BRL and MXN. Any country with large dollar-denominated debts or large external deficits was punished, as a rising dollar and tighter monetary policy from the Fed could weaken the ability to pay back these debts, ultimately leading to deterioration in credit outlook.
Even though the USD has performed well across the board in 2014, we think that there could be further to go in 2015; after all, the dollar has just emerged from 15 years of under-performance, so this could be a structural shift for the USD. Diverging interest rates with the rest of the G10 along with fundamental issues in the EM FX space could fuel another leg higher in the dollar rally in the first half of 2015. Our outlook for 2H 2015 is slightly more nuanced and could rest on the Fed’s willingness to have a stronger currency when the ECB, BOJ, SNB et al are all actively pursuing policies that could weaken their currencies.
This will, no doubt, get answered at some stage in 2015; until then, we think the dollar uptrend may be here to stay.
Abe and the BoJ Have Their Work Cut Out for Them
Japanese Prime Minister Shinzo Abe strengthened his grip on power with a comprehensive win at last Sunday’s elections. On the back of his big win, Abe has pledged to push companies to raise wages in a bid to stimulate the economy. Soft, almost non-existent wage growth in Japan is severely hampering growth. Without increased activity at the ground level of Japan’s economy, a key conduit for growth is going to be closed.
With this knowledge it’s obvious why Abe is making this a key part of his strategy for revitalizing Japan’s economy. He needs to find some success with his growth strategies before he can win support for the rest of his agenda. A weaker yen and a higher sales tax have hit the pockets of many ordinary Japanese people; thus higher wages are needed to offset this and boost consumer spending.
The BoJ
The BoJ is also attempting to boost economic activity through its massive QQE program. At the end of last week, the bank’s board voted to maintain its plan to increase Japan’s monetary base by around 80 trillion yen a year while pledging to watch the risks threatening Japan’s economy and to adjust policy where appropriate. The BoJ reiterated that it will continue QQE until inflation is stable at 2%.
The market currently expects consumer prices to rise by around 2.8% y/y in 2014 and 1.5% y/y in 2015 and 2016. The numbers for this year and, to a lesser extent 2015, may be skewed by Abe’s decision to hike the sales tax to 8% in April 2014; thus real core inflation in 2014 was likely closer to 1% and we are only expecting a very modest improvement in 2015, which is well below the BoJ’s target of 2%, a target which the bank originally forecasted it would meet in 2015 (inflation numbers for November are due out on Friday).
Yen traders should carefully monitor Japanese economic data
The cloud of uncertainty surrounding Japan’s economy is having a huge impact on the yen as the market remains in wait-and-see mode. If the Japanese economy doesn’t begin to show signs of life in the first few months/quarters of 2015 then investors may begin dumping JPY yet again in anticipation of more monetary easing from the BoJ.
When the bank expanded its stimulus program in October, it took the market by surprise, and investors won’t want to be caught out again. In the event that Japanese economic figures consistently surprise on the upside, investors may begin “tapering” their expectations for more monetary easing in Japan.
Positive signs from China’s property market
In China, there was a bit of good news from a key ingredient in China’s growth recipe, its housing market. Over the last few months there have been tentative signs that house prices in China may be bottoming out. This is great news for the boarder economy which is heavily dependent on the housing market.
If house price deflation continues to moderate, it will brighten the outlook for the entire economy. This is especially important given some recent soft industrial production, retail sales and manufacturing numbers which cast doubt over the strength of the economy in Q4. The final days of December aren’t going to provide us with much new Chinese economic data, but things will begin to heat up also immediately in January with the release of final manufacturing PMI figures for December.
Look Ahead: Equities
US stocks have managed to gain back most of their losses this week, setting the stage for a “Santa Rally” as the year-end approaches. On Wednesday, we reported that stocks could bounce back as the Fed prepared to deliver its last policy statement of the year. Not only were we expecting a slightly less hawkish tone from the Fed than was expected, but we were also wary of a technical bounce. Sure enough, the Fed did sound a little dovish as it maintained the “considerable time” pledge in its policy statement and said it would be “patient in beginning to normalize the stance of monetary policy.” This helped to soothe investor nerves, leading to a sharp bounce in the stock markets.
Although a rally into the year-end now looks odds-on for equities, the lack of any major economic data releases over the festive period could dampen the appetite for risk. The ongoing currency crisis in Russia, worries about Greece and uncertainty over sovereign QE from the ECB could also hold investors back a little. Indeed, according to a Reuters report published Friday, the ECB is considering ways to make the weaker Eurozone members – such as Greece and Portugal – bear more of the risk and cost of quantitative easing. The central banks of these nations could be required to set aside extra funds to cover potential losses from any bond-buying. Although this may be exactly what the Germans want, such conditions, Reuters says, could curtail the scope and impact of QE. Therefore, this may not be such good news for the markets. However, the report is not confirmed yet and is lacking a lot of details. What’s more, the introduction of sovereign QE in any way shape or form, and whenever that may be, should spark an immediate response in the global stock markets in the form of a rally.
This coming week will understandably be very quiet in terms of economic data. The main releases will include existing homes sales on Monday, durable goods orders, new home sales, personal income and spending, and the final estimates of GDP and UoM consumer sentiment on Tuesday, and initial jobless claims on Wednesday. The final week of the year will likewise be very quiet; the CB’s consumer confidence survey will be released on Tuesday alongside the Case-Shiller house price index while pending home sales, the latest Chicago PMI and the usual weekly jobless claims will all come out on Wednesday.
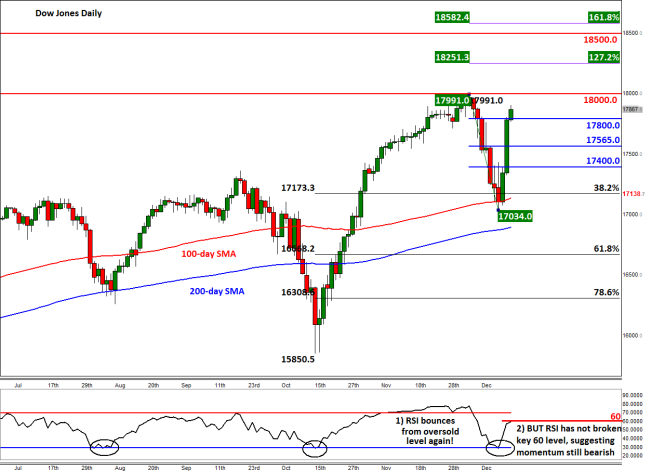
Meanwhile from a technical point of view, further gains look likely for the major indices, such as the Dow. Last Wednesday, we highlighted the fact that a closely-watched momentum indicator, the Relative Strength Index (RSI), had drifted below the oversold threshold of 30. The RSI had created a similar pattern on an intra-day chart, too. Both were therefore suggesting that a rally could be on the cards for stocks. As it turned out, this is exactly what has happened. But as the index is now climbing back towards the prior record high of just below 18000, the RSI is still holding below the key 60 level. The indicator needs to break above this level in order to signal that the momentum has shifted back into the buyers’ favor.
But the fact that the recent sell-off has been halted around the shallow 38.2% Fibonacci level of the last upswing bodes well for the bulls. It suggests that the bulk of the market participants may still be positioned long, hence the sharp rebound following the recent countertrend move. So, as things stand, the longer-term technical outlook for the Dow is bullish. If the index manages to break through the 18000 barrier soon, then it could embark on a rally towards the next Fibonacci extension levels of the recent downswing around 18250 (127.2%) and 18580 (161.8%). There is also a psychological level at 18500 which needs some attention, should we get there. On the downside, the potential support levels to watch are 17800, 17565 and 17400. These were all formerly resistance.
Meanwhile a potential break below the recent low of 17035 could expose the 200-day SMA for a test, at 16895. Below this are the 61.8 and 78.6 per cent Fibonacci levels of the last upswing at 16670 and 16310 which may also offer some support.
Look Ahead: Commodities
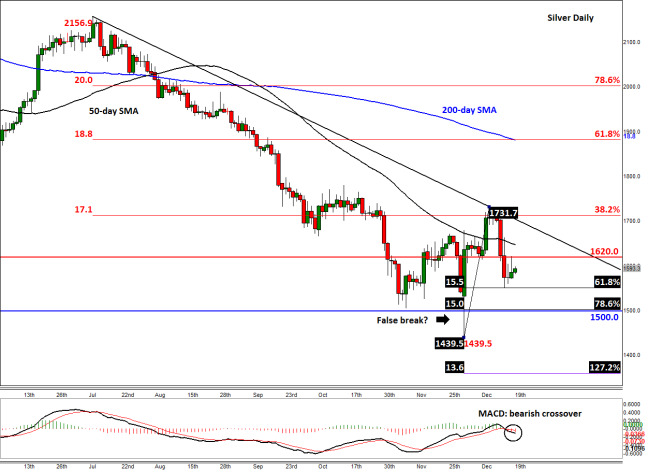
The technical outlook for Silver resembles the color of the metal itself: grey. While we have seen some bullish signs of late, these have merely proved to be short-term countertrend movements and so far the key resistance levels have remained intact. To show you what we mean, let’s quickly recap the recent price action. At the start of the month, for example, silver formed a large bullish engulfing candlestick pattern on its daily chart. This came after the sellers were unable to hold their ground below the prior low and key psychological level of $15. In other words, silver created a potential false breakout reversal pattern on that day, which is a significant bullish development.
Although there was some subsequent follow-through buying over the course of the next week and a half, the rally then came to a halt once price reached the 38.2% Fibonacci retracement level of the last downswing, at just above the $17 mark. This 38.2% Fibonacci level represent a shallow retracement, suggesting the buying pressure was very weak, for otherwise silver should have climbed higher.
Following silver’s move lower over the past several days, the popular momentum indicator MACD has formed a bearish crossover. What’s more, the key support at $16.20 has not only been broken but has now turned into resistance upon retest. However silver has now found some support from the 61.8% Fibonacci level of the last upswing, at $15.50. It is not unusual for price to retrace this deep after making a key reversal pattern (in this case, the reversal pattern being that potential false breakout below $15). In fact, we wouldn’t be surprised even if silver were to drop towards the 78.6% Fibonacci level before bouncing back, for this level also ties in with that psychological $15 mark.
If silver does manage to bounce back from any of these support levels, it could go on to break the bearish trend line before embarking on a rally towards $18.80 level – this being the meeting point of the 200-day moving average and the 61.8% Fibonacci level of the last downswing. Meanwhile a closing break below $15 would invalidate this potentially bullish setup. In this case a drop towards the 127.2% Fibonacci extension level of the last upswing, at $13.60, could be on the cards.
So, in a nutshell, we don’t have a strong technical view on the direction of silver following contradictory signals. However there is potential for a sharp move in either direction as we approach the year-end. Instead of committing to a pre-set course, we will let the price action guide us towards a clearer direction.
Global Data Highlights
Monday, December 22, 2014
- 15:00 GMT Eurozone Preliminary Consumer Confidence (December)
This confidence measure in the Eurozone has failed to improve for six straight months, and judging from the tone of the European Central Bank’s leaders, it might not get much better. The ECB appears ready to introduce Quantitative Easing in early 2015 in an attempt to kick start the floundering economy and buoy inflation in the process, so perhaps the thought of stimulus could turn the tide of unhappy consumers. If we use the German ZEW sentiment surveys as a primer, that thought process holds water as sentiment is beginning to improve in Europe’s most vital state.
- 21:45 GMT New Zealand Trade Balance (November)
The kiwi nation has been struggling in a variety of facets as we head in to the Christmas holiday with the primary reason being an extreme drop in milk prices. Regardless, the Reserve Bank of New Zealand has put the economic world on notice that further interest rate hikes could be coming soon to the region despite some of the concerning warnings of falling commodities and a slowing China. The one benefit to falling milk prices could be an eventual increase in demand for the product which could help balance NZ trade more toward the positive side. Even though a surplus hasn’t been achieved since mid-2014, and increased interest in milk could shift that balance dramatically.
Tuesday, December 23, 2014
- 2:00 GMT Conference Board’s Chinese Leading Economic Index (November)
Chinese PMIs have failed to maintain growth over recent months which have brought many of the “hard landing” doomsayers back to the front of Chinese economic discussion. Despite those disappointments, GDP is still strong in the nation and the People’s Bank of China has been providing adequate amounts of stimulus to supplement any slowdown so far. While that tact has worked in the past for the PBoC, skepticism abounds and a maintaining of other figures like today’s will have to follow. If this metric drops from the 0.9% seen last month, watch for a corresponding drop in the AUD.
- 7:00 GMT German Retail Sales (November)
The German consumer has been a little fickle over the last few months as consumption has fluctuated wildly from positive to negative for six consecutive months. If the pattern holds true, we should expect a negative result this time around, but the pattern itself is surely more coincidence than function. However, if it improves upon last month’s 1.9% gain, the EUR may find some strength in the face of potential QE to come.
- 9:30 GMT UK Final Gross Domestic Product (Q3)
This report is usually a foregone conclusion as revisions to previous data are rare, but considering the importance of the figure and the lack of liquidity that is sure to pervade on this day, the market could move significantly if a revision is seen in either direction.
- 13:30 GMT US Durable Goods Orders (November)
This is one of the most difficult figures to predict for economists with consensus often times being incorrect on the final figure by 1% or more. That unpredictability spurs wild market action as virtually everyone is left scrambling to take advantage of the outcome. Even though GDP is being released simultaneously, this may have a larger market impact as GDP likely won’t be very far away from estimates.
- 13:30 GMT US Final Gross Domestic Product (Q3)
By all measures so far, the third quarter of 2014 was a banner one for the US economy with a 3.9% increase in GDP if nothing changes from the second revision, however, changes have become the norm with US GDP releases of late. Each of the Q3 estimates so far have bettered consensus by at least 0.5% as the economy is performing even stronger than anticipated. If that trend continues, it would be a very positive sign for the US economy and would cement the notion that the Fed will soon be raising interest rates.
- 13:30 GMT Canadian Final Gross Domestic Product (October)
With the recent decline of oil prices, Canada may be struggling to cope with the loss of income. Canada is the world’s leading exporter of crude to the US, and while lower prices may help increase demand, it also tightens profit margins. Expectations are low so far with only 0.1% increase anticipated, but watch for a disappointment due to oil.
- 15:00 GMT US New Home Sales (November)
While most US economic releases have peacocked their way to attention by performing admirably in relation to their usual performance or consistently beating consensus, New Home Sales have squandered along. Only once out of the last five months has this measure been able to print in the green in relation to expectations. Simply following the formula of the rest of US data, one might thing that this is due for a good figure.
- 23:00 GMT Conference Board’s Australian Leading Index (October)
For two straight months this index has declined after posting three straight increases. The economic situation in Australia hasn’t been looked upon too kindly over the last couple weeks, particularly in relation to New Zealand. Considering this index measures back to October, there may not be a lot of good numbers to go off of, so watch for another bad result.
Wednesday, December 24, 2014
- CHRISTMAS EVE
Thursday, December 25, 2014
- 23:30 GMT Japanese Household Spending (November)
Even though this release is on Christmas Day it could hold some sway for market moves on Friday. Japanese leadership is scrambling for ways to increase consumption in an effort to boost inflation, and if Abenomics has any leg to stand on economically, this is the type of release that needs to improve. There have been seven straight declines of at least 3% or more in this category, so for the sake of Abe the worm needs to turn eventually. Perhaps the surprise of extra stimulus the BoJ provided on Halloween did the trick.
Friday, December 26, 2014
- NO NEWS
Monday, December 29, 2014
- NO NEWS
Tuesday, December 30, 2014
- 15:00 GMT Conference Board’s US Consumer Confidence (December)
This week will likely be a dry one in terms of liquidity, but there are still economic releases to behold, and consumer confidence is always an interesting one to track. It is no secret that the US consumer has a lot to be optimistic about lately with the strength of employment, rise of the Dow, and the drop in gas prices. Unless you’re actively seeking negative news, it is getting very hard to come by in the realm of economics, therefore watch for a potential surge in this indicator.
Wednesday, December 31, 2014
- 0:30 GMT Australian Private Sector Credit (November)
Increases or decreases in the amount that the private sector borrows can be a clear indication in the optimism or pessimism of consumers as a whole, and the last two results on this measure have been surprisingly strong. While most of the world has looked at Australia pessimistically, Australian consumers appear more optimistic by borrowing more on credit. However, with recent slides in Chinese data, Australian consumers may become a little more frugal as dark clouds on the horizon have inched ever closer.
- 1:45 GMT HSBC Final Chinese Manufacturing PMI (December)
The Preliminary result of this figure was dire as it finally fell below the 50 line that demarcates growth from contraction. The trend lower has been clear since July as this metric has slowly declined ever lower. The only hope for any positivity out of this would be for the final to pop back above 50 unexpectedly, and if it were to do that, the AUD may be the biggest benefactor.
- 15:00 GMT US Pending Home Sales (November)
Much like the New Home Sales mentioned earlier, Pending Home Sales has had some trouble getting out of bad and in to good. Four out of the last five results have failed to live up to expectations despite a strong economy surrounding the housing market. Eventually, bad results beget depressed expectations which are then more easily surpassed, but with the strength of the US economy as a whole, consensus might not depress expectations that greatly making a beat that much more difficult to achieve.
Thursday, January 1, 2015
- NEW YEAR’S DAY
Friday, January 2, 2015
- 9:00 GMT Markit Final Eurozone Manufacturing PMI (December)
The final figures typically don’t deviate from the preliminary all that widely, but any drop from what it was before would be another reason for investors to pile on the Eurozone. With potential QE coming from the ECB in early 2015, investors may start ramping up their EUR selling and any excuse to do so may be preyed upon.
- 9:30 GMT Markit Final UK Manufacturing PMI (December)
Guilt by association is the name of the game when it comes to the UK as they are still a part of the EU and therefore economically depressed because of them. However, UK PMIs have been improving over the last couple months, and maybe investors will begin to disassociate the GBP from the EUR if that trend can continue.
- 9:30 GMT UK Net Lending to Individuals (November)
This measure has largely followed the script over the last five months as major deviations from consensus have become rare. However, this figure could help the UK separate themselves from mainland Europe with some good data and help boost the GBP in the process.
- 15:00 GMT ISM US Manufacturing PMI (December)
Strange as it may seem to be contemplating Non-Farm Payrolls so soon again after last month’s blow out 300k+ result, it is that time once again. The ISM Manufacturing’s employment subcomponent is an important measure of strength in hiring and could give a strong clue toward the all-important employment release at the end of the week.
Monday, January 5, 2015
- 13:00 GMT German Preliminary Consumer Price Index (December)
Europe’s largest and most important state has had absolutely no growth in inflation since August and has actually declined 0.3%. Of course, this lack of inflation is the main reason the ECB is looking toward QE, and another lackluster result here could only strengthen the case for the need of stimulus.
Tuesday, January 6, 2015
- TENTATIVE Global Dairy Trade Price Index
Milk prices have fallen for an overwhelming majority of 2014 which has weighed heavily on the NZ economy and the NZD as a result. On a positive note though, the last measure in 2014 (on December 16th) showed an increase of 2.4%, which may be indicating that the swoon could be ending. For 2015 to get off on the right foot for the NZD it is almost requisite for milk prices to begin the long climb back up.
- 15:00 GMT ISM US Non-Manufacturing PMI (December)
As important of a measure as ISM Manufacturing PMI is, the Non-Manufacturing measure is even more vital. Approximately 80%+ of the US workforce is service based, which is what this figure measures. If the employment subcomponent were to be strong, it would favor heavily the odds of another strong NFP report at the end of the week. Investors coming back from the holidays may be looking for a good reason to buy as they start the New Year, and this may provide the incentive.
Wednesday, January 7, 2015
- 10:00 GMT Eurozone Preliminary Consumer Price Index (December)
The EZ inflation readings haven’t been as bad as those from Germany, but they haven’t been anything to brag about either. The consistent 0.3%-0.4% figures wouldn’t be too bad if they were MoM figures, but they’re YoY, putting them well below the 2.0% target the ECB would prefer. This is the main reason Mario Draghi and the ECB are discussing QE, and this result likely won’t do much to dissuade them from discussing it further.
- 19:00 GMT Federal Open Market Committee Meeting Minutes
The Fed changed their monetary statement slightly by replacing “considerable time” with “patience” in regard to interest rate normalization, and Chairwoman Janet Yellen mentioned in her press conference that they wouldn’t even begin raising rates for at least a “couple” more meetings. Academic discussions about the definition of “couple” will likely commence over the next couple months (Ha! See what we did there?), but even Yellen conceded that things can change based on data, as she always does. Interestingly, there were three dissents to the statement, so there were likely some intense discussions over what should have been written as opposed to what actually was. A more hawkish leaning undercurrent could boost the USD even further to start the New Year.
Thursday, January 8, 2015
- 10:00 GMT Eurozone Retail Sales (November)
At this point in the Eurozone the only thing most investors are going to be paying attention to is whether figures support or refute the use of QE by the ECB. Unfortunately, Retail Sales in November likely won’t influence that discussion greatly, but nonetheless, they haven’t been stellar over the last few months. Considering the fog that has surrounded everything EZ, consensus for this figure may be low therefore making it more amenable to a surprise positive result. If that is the case, the EUR may find reason to rally before the QE storm hits the fan.
- 12:00 GMT Bank of England Interest Rate Decision
Unlike many of their counterparts around the rest of the developed world, the BoE has been steadfastly inactive and hasn’t hinted at any change to that status. Typically the BoE meeting comes mere hours before the ECB bonanza and is usually overlooked, but it takes sole billing on this day and therefore may attract more attention. Don’t expect much though as they have no discernable reason to rock the boat.
- 23:50 GMT Japanese Machinery Orders (November)
A decent measure of future demand from consumers, Machinery Orders gets us essentially to the front lines of consumer habits. If manufacturers are getting more equipment, it likely means that they are ramping up operations to meet demand and vice versa if they don’t. The surprise stimulus from the BoJ at the end of October may have been effective in boosting consumption, and if that is the case, watch for a big rebound from last month’s disappointing 6.4% decline in this figure.
Friday, January 9, 2015
- 0:30 GMT Australian Retail Sales (November)
Aussie Retail Sales have been more resilient over the last six months than many pundits have anticipated. While employment figures have been much less desirable, Retail Sales have either beat or met consensus in four out of the last six months, and all six have shown an increase from the months previous. If it can keep the trend going, this may be a bright spot in an otherwise depressing state of affairs for the AUD.
- 1:30 GMT Chinese Consumer Price Index (December)
One of the most reliable ways to actually gauge the strength or weakness of the Chinese economy is to tune out the Chinese economic releases and media reports and look at the People’s Bank of China. They are usually the ones who have their ear closest to the ground and make changes based on what they see. Those changes are usually borne out when subsequent data is released and judging from the actions of the PBoC lately, you should be worried. The PBoC has been very active over the last couple months with the most recent being a surge of short-term loans offered in the week before Christmas. As the old saying goes, “Where there’s smoke, there’s fire,” so watch for a potential decline in this figure.
- 9:30 GMT UK Industrial and Manufacturing Production (November)
The UK will most likely be sitting in the shadows of the speculation about what is happening in the EZ in the lead up to the ECB meeting on January 22nd, but economic releases still take at least a little precedence. Last month’s decline in both of these figures wasn’t making anyone feel great about the future growth of the UK, but it wasn’t exactly time to hit the panic button either. If these figures jump back to positive territory the GBP could benefit greatly.
- 13:30 GMT US Non-Farm Payroll, Unemployment Rate, and Average Hourly Earnings (December)
By now you’ve probably heard about the 321k blowout figure in NFP last month which was well above even the most optimistic of expectations heading in to the release. This month may be looked at with more curiosity to see if the momentum can be maintained or if there is a snap back to reality in store. Consensus expectations will likely be for another 200k+ result, and may even be more along the lines of 250k if the leading metrics show strength. All of this positivity sets up for a disappointment though as this may come back to the mean a little more than anticipated.
- 13:30 GMT Canadian Employment Change and Unemployment Rate (December)
In opposition to the US data last month, Canadian employment actually declined and missed consensus expectations. The fall of 10.7k also went against the grain of the last two results that were extraordinary at 74.1k and 43.1k. It is interesting to note that each of the last six times that Canadian employment declined, the next month brought forth a figure that was better than consensus; will this be the seventh?
