Very rare event nowadays
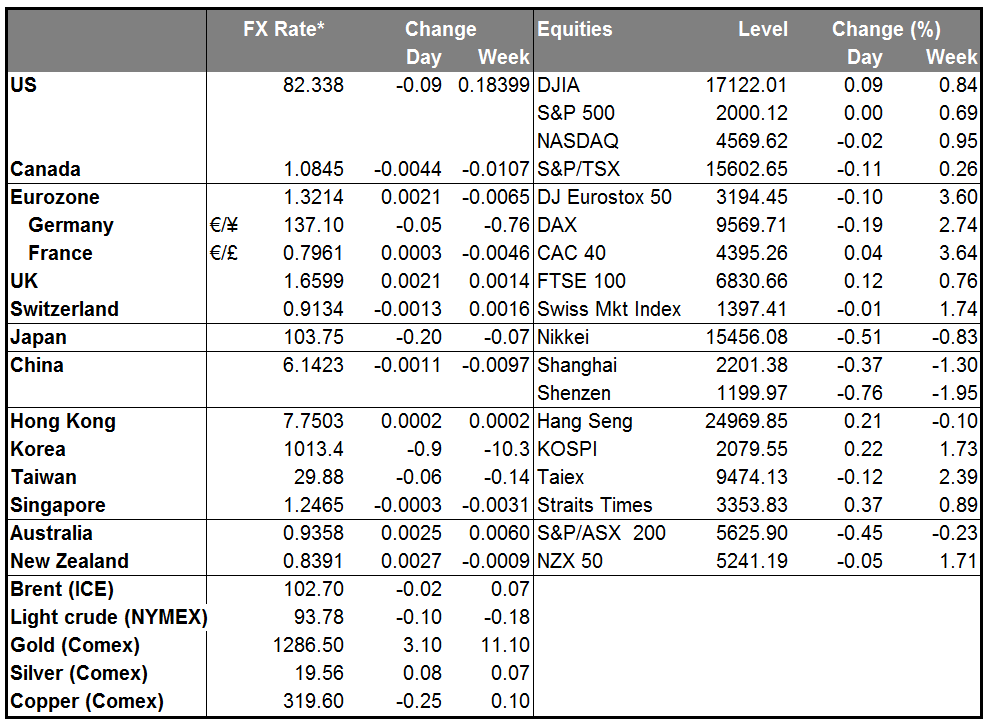
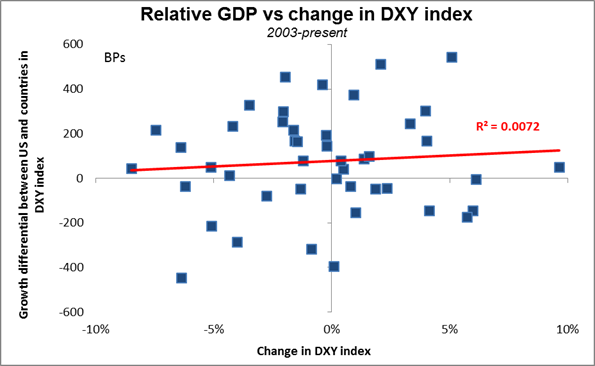
The dollar is opening in Europe lower against every single currency that we track! Both DM and EM currencies gained across the board vs the US, apparently in anticipation of a downward revision in 2Q GDP due out today (see below). I’m not so sure this is germane, however. The fact is, I could find no consistent relationship between relative growth rates and the dollar’s value. Indeed, there have been significant periods when the dollar gained vs EUR when US growth was weaker than Europe’s, and fell when US growth was stronger – probably because US consumers tend to go buy stuff when the economy is good, and a lot of what they buy is imported. I think interest rate differentials are much more important than relative growth rates.
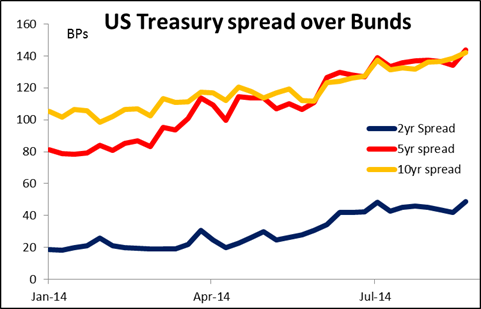
Of course, investors may be reasoning that slower GDP growth may mean slower employment growth which means slower tightening, and indeed the implied interest rate on the longer-dated Fed funds futures fell 2.5 bps yesterday. But the relative spread over Europe is widening as Bund yields collapse – Bund yields are now negative out to three years! – which is a very different picture from the US. Given this background, it looks to me like just some end-month profit-taking after a few stand-out days of USD rallies and I expect we will quickly get back to buying dollars once September comes around.
The Canadian dollar was the standout among the G10 currencies, boosted by Burger King Worldwide Inc.’s proposed takeover of Tim Hortons Inc. A legal loophole allows US and non-US companies to combine in transactions that move the US corporation to a non-US jurisdiction where corporate tax rates are lower. Canada benefits from this transaction model, and more cases may follow Burger King’s move if it’s successful (although there are steps afoot in the US to prevent such maneuvers). The takeover bid came at a technically sensitive level, after USD/CAD had failed to break through the 1.1000 level four times in a month. The strong resistance there helped to send the pair crashing. USD/CAD can probably fall further on continued momentum, although in the longer-term picture I still think the trend is up, both from a technical and fundamental view.
Australia’s Q2 private capital expenditure unexpectedly rose, contrary to market expectations of a decline. RBA Gov. Stevens has identified the decline in capital spending by mining companies as one of the key features of the Australian outlook and said the expected further fall in investment is “captivating” commentators, so the rise was quite a surprise. AUD strengthened on the news, although not as much as one might have expected.
Today’s indicators: During the European day, the preliminary German CPI for August is expected to have remained unchanged at 0.8% yoy from July. As usual the drama will start several hours earlier when the CPI for Saxony is released ahead of the country’s headline CPI. If it does remain unchanged, the market might interpret that as taking some pressure off the ECB to ease at next week’s meeting. Medium-term inflation expectations as defined by ECB President Draghi (the 5yr/5yr forward inflation swap) have moved back to 2.0%, which also takes some pressure off the ECB. Nonetheless, on top of last week’s poor German Ifo readings, the low inflation rate adds to the sense that the bloc’s strongest economy is getting weaker and further measures from the ECB are inevitable eventually. Plus Draghi said that the Governing Council “will acknowledge” the recent movements; this implies some action. I think there’s a strong possibility that they announce some concrete plan for quantitative easing at next week’s meeting regardless of today’s figure.
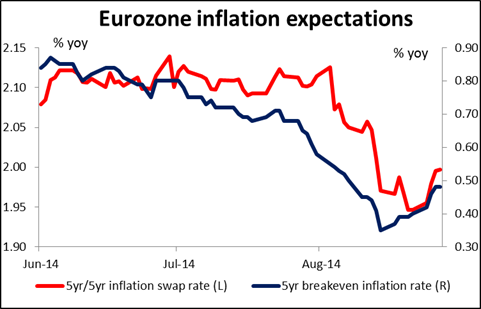
The German unemployment rate for August and Eurozone’s final consumer confidence for the same month are also coming out. Eurozone’s M3 money supply is forecast to have risen 1.5% yoy in July, the same pace as in June. This will push the 3-month moving average slightly higher if the forecast is met.
From Sweden, retail sales for July are anticipated to decelerate.
In the US, the 2nd estimate of GDP for Q2 is expected to rise 3.9% qoq SAAR, down from the 1st estimate of +4.0% qoq SAAR Q2. The 2nd estimate of the core personal consumption index, the Fed’s favorite inflation measure, is forecast to remain unchanged at the Fed’s 2% target. Pending home sales for July are expected to rebound from June, which will slow down a touch the yoy decline. Initial jobless claims for the week ended August 23 are also coming out. Overall the positive data could strengthen USD, following Wednesday’s broad declines.
From Canada, the Q2 current account deficit is forecast to stay in line with the previous figure.
ECB Governing council member Erkki Liikanen speaks.
The Market
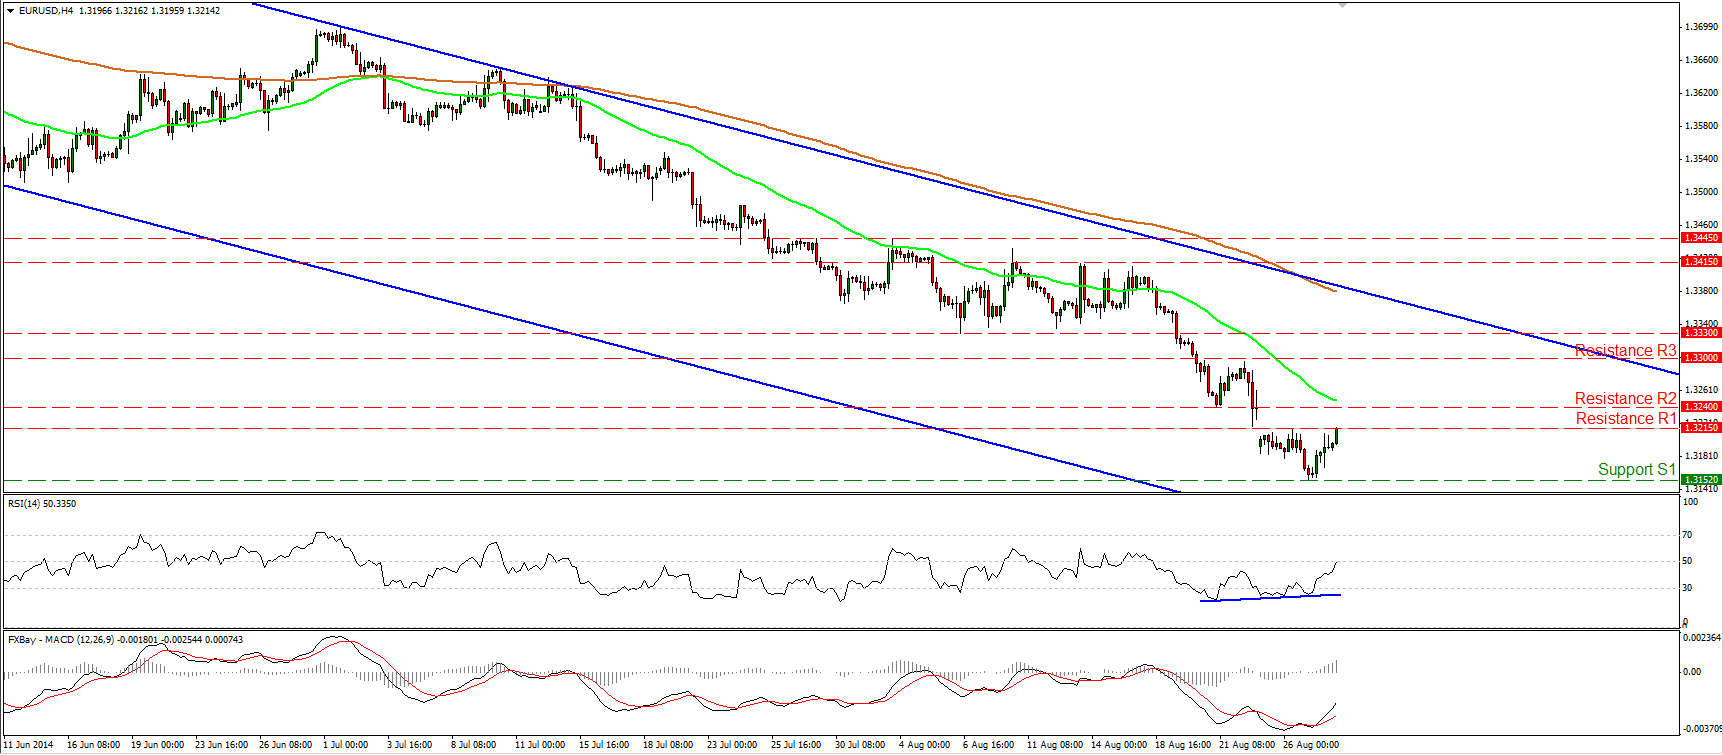
EUR/USD rebounds from 1.3152
The EUR/USD rebounded from 1.3152 (S1) on Wednesday, and moved higher to find resistance above the 1.3200 line, at 1.3215 (R1). Although I still consider the overall trend to be to the downside, I would be cautious on the continuation of the rebound. Personally, I would expect the corrective phase to start after reaching the lower bound of the long-term downtrend channel, near the 1.3100 (S2) line, but it may have started a bit earlier. The rebound confirmed the positive divergence between the price action and the RSI, while the latter looks ready to move above its 50 line now. A price move above 1.3215 (R1) is likely to find resistance at 1.3240 (R2). On the daily chart, the 14-day RSI moved above its 30 line, while the MACD shows signs of bottoming and could move above its signal line in the near future. As a result, I would take a flat stance as far as the near-term bias is concerned, as a corrective phase may have started earlier than I would expect.
• Support: 1.3152 (S1), 1.3100 (S2), 1.3000 (S3).
• Resistance: 1.3215 (R1), 1.3240 (R2), 1.3300 (R3).
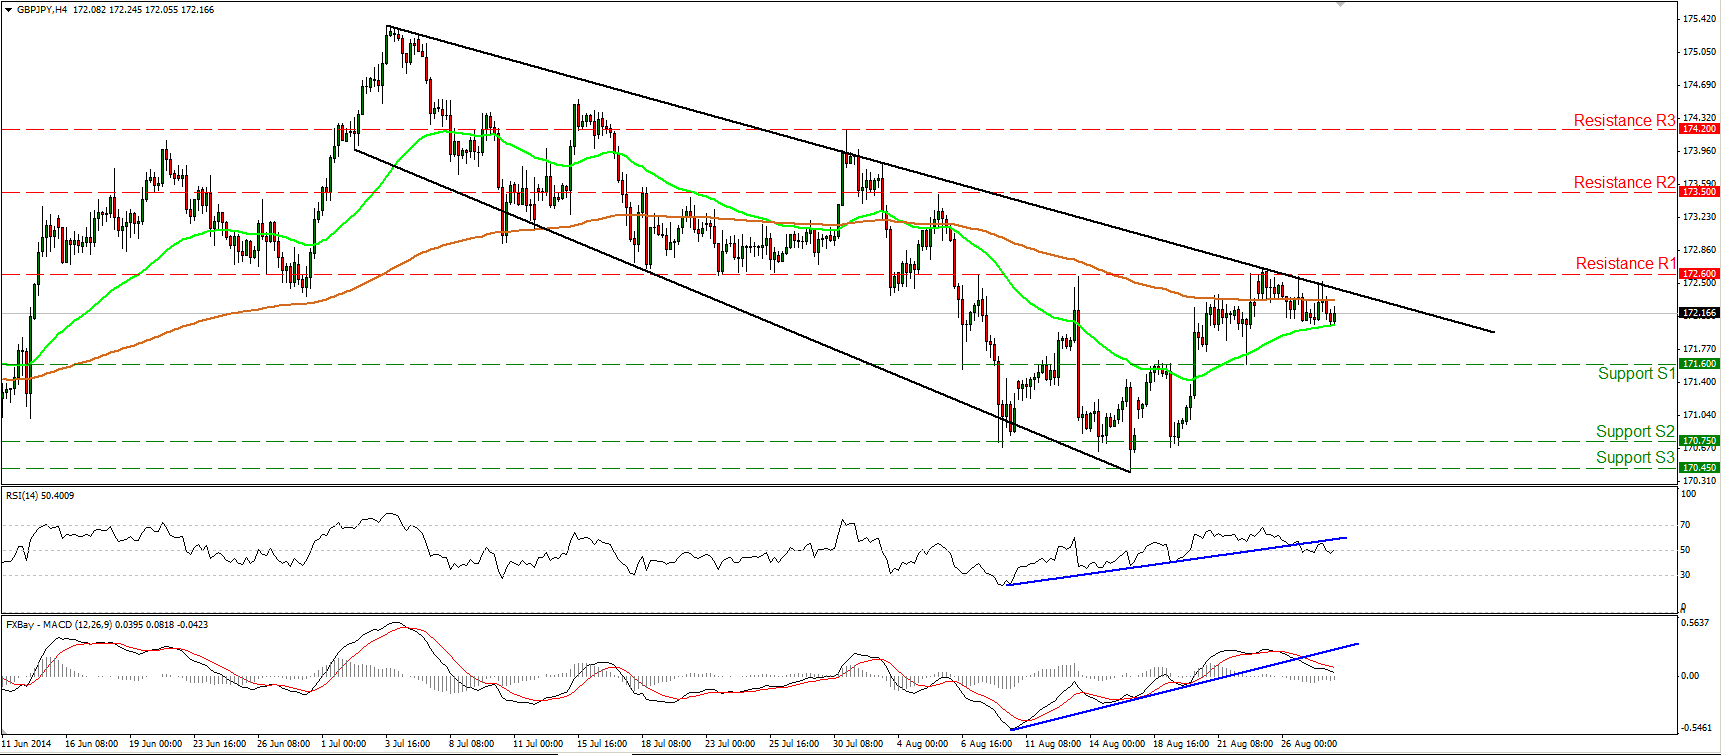
GBP/JPY remains near the downtrend line
GBP/JPY moved slightly lower, remaining near the black downside resistance line. Both the RSI and the MACD moved below their blue upside support lines, while the latter, already below its trigger, could become negative any time soon. As long as the rate remains below the downtrend line, the outlook remains cautiously to the downside. A dip below the 171.60 (S1) support line will confirm that the downside path is still intact and could pull the trigger for extensions at least towards the next barrier, at 170.75 (S2).
• Support: 171.60 (S1), 170.75 (S2), 170.45 (S3).
• Resistance: 172.60 (R1), 173.50 (R2), 174.20 (R3).
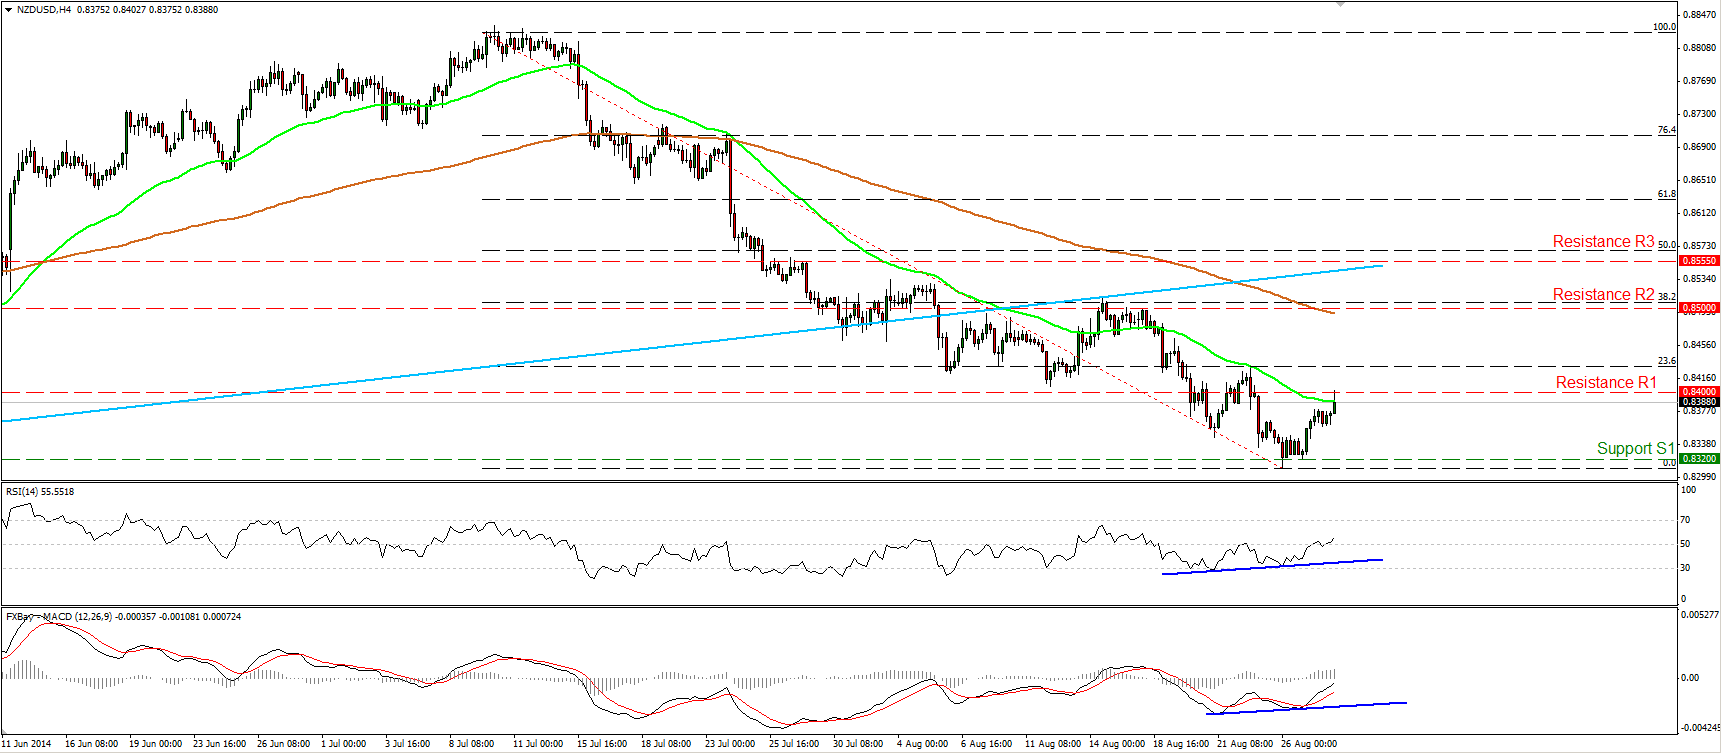
NZD/USD forms a morning star
NZD/USD found support at 0.8320 (S1) and rebounded to challenge the 0.8400 (R1) line as a resistance this time. The RSI moved above its 50 line, while the MACD is pointing up and appears ready to obtain a positive sign in the close future. Moreover, I see positive divergence between both the studies and the price action. A clear move above the 0.8400 hurdle could confirm the divergence and could pave way towards the next resistance at 0.8500 (R2). On the daily chart, I can see a morning star candlestick pattern, magnifying the case for a near-term rebound. The 14-day RSI and the daily MACD also support the case, since the former exited oversold conditions and is pointing up, while the latter is ready to cross above its signal line. Nevertheless, as long as the rate is trading below the long-term downtrend line, drawn from back the 30th of August 2013, I will stick to the view that the overall outlook is to the downside and I would see any bullish movements as a retracement at the moment.
• Support: 0.8320 (S1), 0.8270 (S2), 0.8185 (S3).
• Resistance: 0.8400 (R1), 0.8500 (R2), 0.8555 (R3).
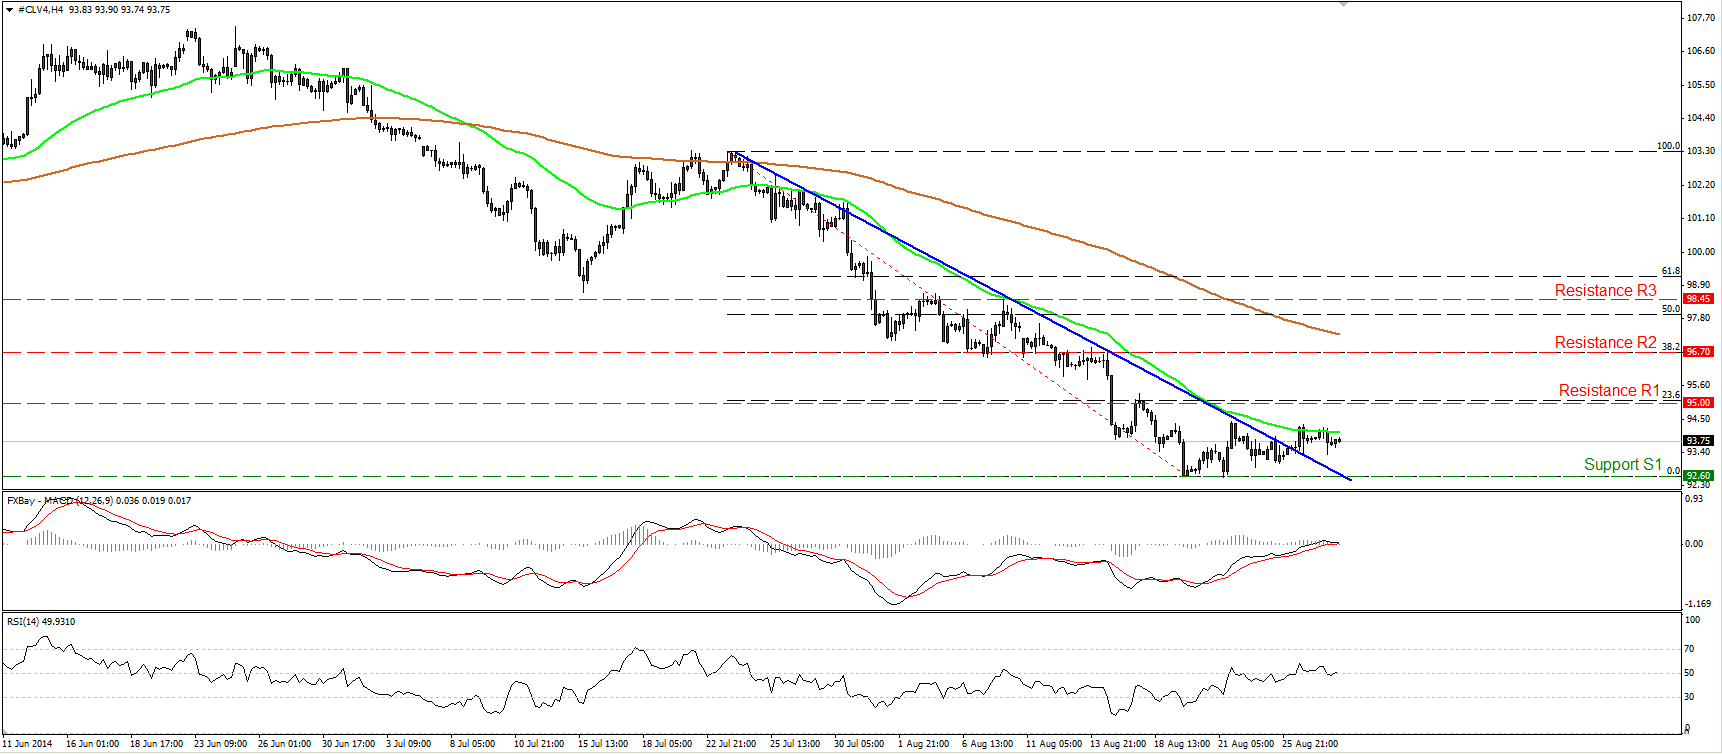
WTI in a consolidative mode
WTI moved in a consolidative mode yesterday, remaining below the 50-period moving average. I would not rely on our momentum indicators for now, since the MACD is trying to dip back in its negative territory, while the RSI have rebounded somewhat from its 50 line. I will remain neutral for now and I would wait for a move above the obstacle of 95.00 (R1), which lies near the 23.6% retracement level of the 23rd July – 19th August downtrend, before taking the positive side. Such a move is likely to target our next resistance line, at 96.70 (R2), which is the 38.2% retracement of the aforementioned downtrend. On the downside, only a clear dip below 92.60 (S1) is likely to signal a forthcoming lower low and revive the bearish case.
• Support: 92.60 (S1), 91.60 (S2), 90.00 (S3).
• Resistance: 95.00 (R1), 96.70 (R2), 98.45 (R3).
Gold somewhat higher
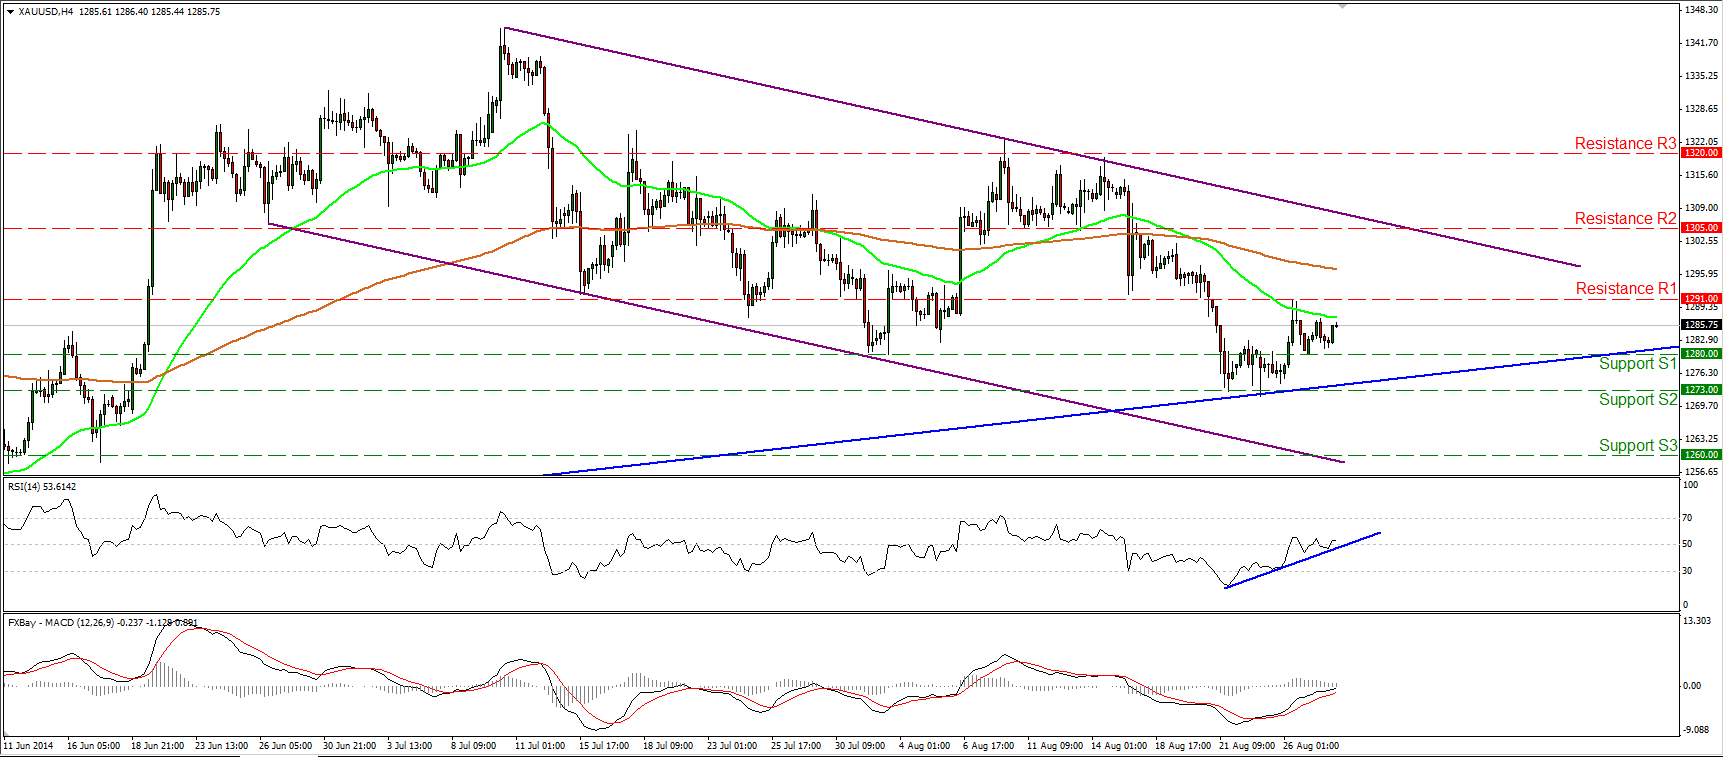
Gold moved slightly higher – 2.04 dollars or 0.16% -- and remained between the support of 1280 (S1) and the resistance of 1291 (R1). The RSI continued moving higher and moved above its 50 line, while the MACD, already above its signal line, appears willing to become positive. Having these momentum signs in mind and in light of the fact that the metal found support at the long-term trend line drawn from back at the low of the 31st of December, we may experience further upside in the near future. A decisive move above the 1291 (R1) resistance is likely to confirm the upside scenario and could probably see scope for extensions towards the 1305 (R2) line, near the upper boundary of the purple downside channel, connecting the highs and the lows on the daily chart. Both the 14-day RSI and the daily MACD lie below their downside resistance lines. As long as this is the case and as long as the yellow metal is trading within the purple downside channel, I would see any possible upside waves as a corrective move.
• Support: 1280 (S1), 1273 (S2), 1260 (S3).
• Resistance: 1291 (R1), 1305 (R2), 1320 (R3).

