When building out an ETF portfolio, many investors prefer to slant their large-cap U.S. stock exposure towards growth or value characteristics.
The benefit to this methodology is that you have greater flexibility to hone in on a specific theme that you (or your advisor) believe will outperform over the long run. The downside is that you may choose wrong and end up leaving money on the table versus a traditional broad-based index such as the iShares S&P 500 ETF (ARCA:IVV).
Now fear of making a wrong choice should never hold you back from implementing a structured ETF portfolio. In fact, there is a commonly held belief that if you aren’t worried about something in your account, then you aren’t diversified enough. Meaning that a truly broad array of assets should always have something underperforming based on the prevailing market environment. Diversification is meant to smooth out peaks and valleys in your returns, not fire on all cylinders at all times.
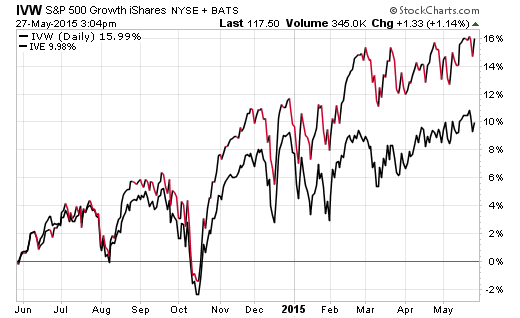
A quick look at the performance comparison between the iShares S&P 500 Growth ETF (NYSE:IVW) and iShares S&P 500 Value ETF (ARCA:IVE) over the last year shows a marked disparity in total return. Growth stocks have exhibited strong relative momentum, while value companies have plodded along at a slower pace.

Interestingly enough, this same story repeats itself if you widen the scale to 3 or 5-year time frames. Despite the steady gains in value stocks, growth has simply been the place to be.
So what caused that divergence and what factors may ultimately lead to resurgence in value stocks?
An in-depth look at IVW (growth) shows that the basket of 325 stocks is heavily weighted towards technology and health care companies. Together these two groups make up more than 50% of the assets and have continued to be top performing areas of the market. Health care in particular has been one of the most resilient sectors overall and continues to demonstrate remarkable comparative momentum.
On the flip side, IVE (value) is comprised of a healthy dose of financial and energy companies in its 360 holdings. Financial stocks make up 24% of the total underlying sector allocation, with Berkshire Hathaway Inc (NYSE:BRKa, BRKb) being the largest stock in this group. The financial sector has struggled to make any positive headway this year and has clearly been a drag on the return in IVE. In addition, the well-documented energy sector woes have weighed on returns in this ETF over the last 12-months.
The low interest rate environment coupled with deflating commodity prices has been a drag on a significant number of stocks that make up IVE. Ultimately, a change in tenor that sees energy prices surge or banking stocks breakout would lead to a transformation in comparative leadership. A scare in the market that prompts an exit from high momentum stocks would also likely send money towards more stable value-oriented companies as well.
Those that have owned IVE or other value indexes for some time should still be satisfied with the overall gains and low volatility that this segment has produced. In addition, because of the length in time of growth leadership, we may be nearing a point of greater emphasis for value stocks.
The Bottom Line
The point of this analysis is to call attention to how these indexes are constructed and what factors may influence overall performance moving forward. Understanding what you own and why you own it is an important component to a successful investment plan. You should be keenly aware of how your own portfolio is constructed and where areas of potential strength and weakness may lie. With that knowledge you can make strategic adjustments to lower volatility and improve your returns overall.
Disclosure: FMD Capital Management, its executives, and/or its clients may hold positions in the ETFs, mutual funds or any investment asset mentioned in this article. The commentary does not constitute individualized investment advice. The opinions offered herein are not personalized recommendations to buy, sell or hold securities.
