As strange as it may seem, there are times when good economic data is bullish and other times when good economic data may be bearish. The same is true for bad economic data, which can elicit both good and negative market reactions. Typically, the deciding factor for how such incoming data will be interpreted is in how it will drive changes in monetary policy.
As an economic expansion begins, good economic news is bullish as it proves to investors that the economy is coming out of a recession. However, eventually the recovery picks up steam and matures to the point where the Fed decides to take away the punch bowl and start raising rates to prevent elevated levels of inflation or overheating in the economy. It is at this point where the market's reaction function "switches polarity" and incoming economic data is now interpreted as a negative market signal because it means there is a greater chance the Fed will be raising interest rates in the near future...which is where we find ourselves now.
In Fed Chairwoman Janet Yellen’s semi-annual testimony to Congress this week she said the following which caused the markets to initially sell off:
“If the labor market continues to improve more quickly than anticipated by the committee, resulting in faster convergence toward our dual objectives, then increases in the federal funds rate target likely would occur sooner and be more rapid than currently envisioned.”
Since Yellen made it clear the Fed is using employment data as a key barometer for when to raise rates, let's look at past economic cycles to determine when this initial rate hike may occur and, more importantly, how the market may react in the days ahead.
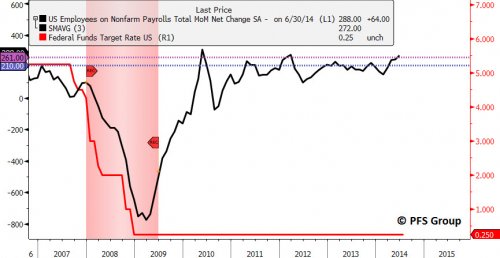
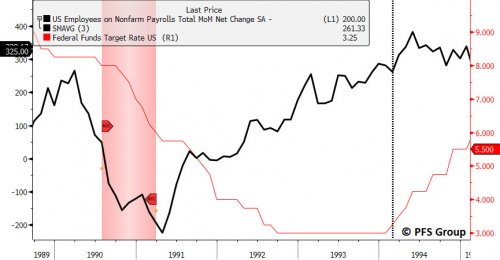
The 1990-1991 recession saw the 3-month average of the monthly payroll change move from the upper 200K range to below -200K just after the recession ended. In late 1991 monthly payroll growth moved back into positive territory and continued to accelerate throughout 1992-1994 and eventually the Fed began to hike interest rates to cool the economy. This occurred in early 1994 when the Fed raised the Federal Funds Target Rate from 3% to 3.25% after it had been flat for more than a year. The 3-month average of monthly payroll growth at the time of the first hike was 261K jobs being added.
After the 2001 recession, the Greenspan Fed continued to lower interest rates before their final low of 1% in 2003 and it wasn’t until the middle of 2004 that Greenspan first began to hike interest rates by a quarter percent. At the time, the 3-month average of monthly payroll growth had accelerated to 210K jobs being added in 2004 when the Greenspan first hiked rates.
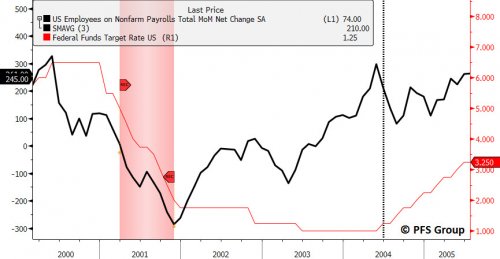
In the present case, we are averaging 272K jobs being added a month over the last three months which is above the 261K level seen in 1994 (purple line) and the 210K level seen in 2004 (blue line).
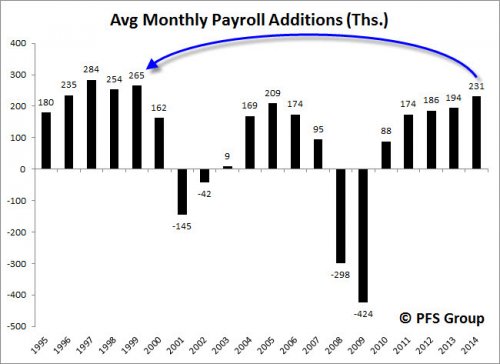
We’ve seen 3-month averages of monthly payroll growth over 250K in 2010, 2011, and 2012 without the Fed raising interest rates or even hinting at raising interest rates. What makes the present pace of payroll growth different is its persistence at this higher level. In 2010 the average monthly payroll growth was 88K jobs a month, 174K a month in 2011, 186K in 2012, 194K in 2013 and 231K this year. Clearly, payroll growth is accelerating and this year is the strongest employment growth rate seen in 15 years.
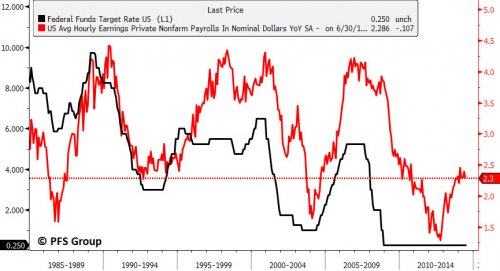
Another factor that makes this year’s strong payroll growth different than prior years is the acceleration in wage inflation. The Fed pays close attention to payroll growth as wage inflation typically follows employment growth rates. Wage inflation bottomed in October 2012 at 1.3% and has been steadily rising ever since with the current level at 2.3%, and is likely a key reason the Fed is throttling back on the accelerator by ending quantitative easing. Investors should take note that when Greenspan first hiked rates in 2004 wage inflation was running at 2.0%, below the current 2.3% rate.
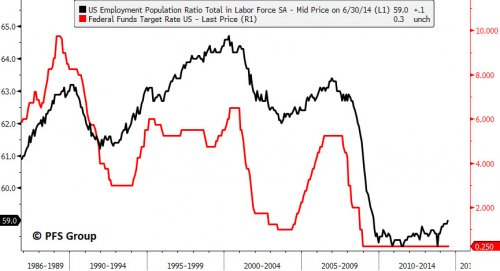
Besides wage inflation and a pickup in employment growth, other indicators are suggesting it shouldn’t be too long before the first Fed rate hike occurs. There is a strong correlation between the Fed Funds Target Rate and the employment population ratio that is accelerating to the highest level seen in five years.
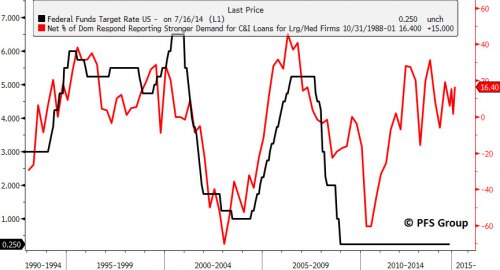
Similarly, loan demand for commercial and industrial (C&I) loans for large and medium sized firms is well off the lows seen in 2010 and also argues for a higher Fed Funds Rate.
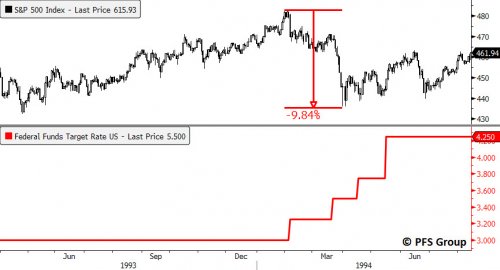
Why is the focus on when the first Fed Rate hike will occur so important? The answer lies within the market’s reaction to the onset of higher interest rates. Typically the market begins to discount an eventual interest rate raising cycle by stalling before or at the onset of the first hike. In the case of the 1994 initial hike, the S&P 500 witnessed a 10% correction over a two month period before stocks found their footing as higher interest rates did not slow down the US economy.
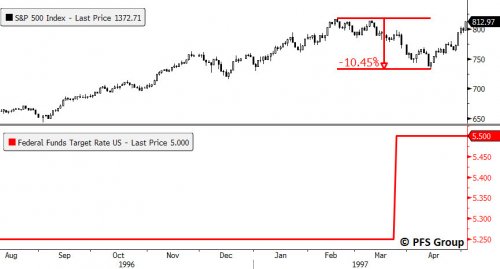
In 1997 Greenspan again began to hike interest rates with the S&P 500 stalling the month prior and witnessing just over a 10% correction over a two month period before advancing to new highs.
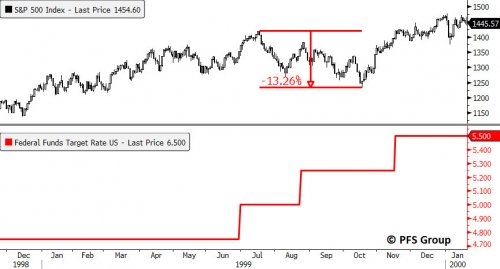
In 1999 the stock market fell coincidentally with a higher Fed Funds Target Rate with a 13% correction over a three month period before hitting new highs.
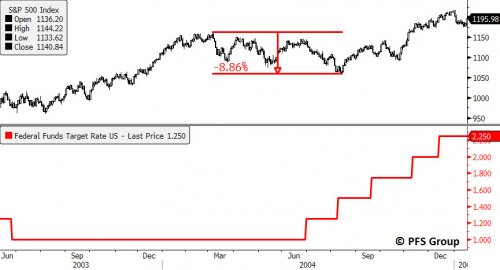
The most recent example is the 2004 case in which the S&P 500 advance stalled several months before the first hike and saw a roughly 9% correction over a four month period.
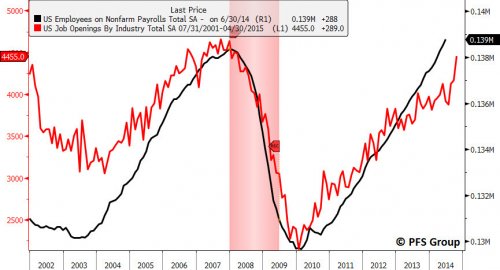
Given employment leading indicators like job openings from the BLS Job Openings and Labor Turnover Survey (JOLTS) suggest employment growth should continue to accelerate into the end of the year, we are likely to hear the growing drum beat of the first Fed rate hike, and thus we should expect the market to weaken as it historically has, likely later in the fall. Now may be the time for investors to put aside a focus on return and instead sharpen their risk management skillset as it is likely to be tested later this year.
