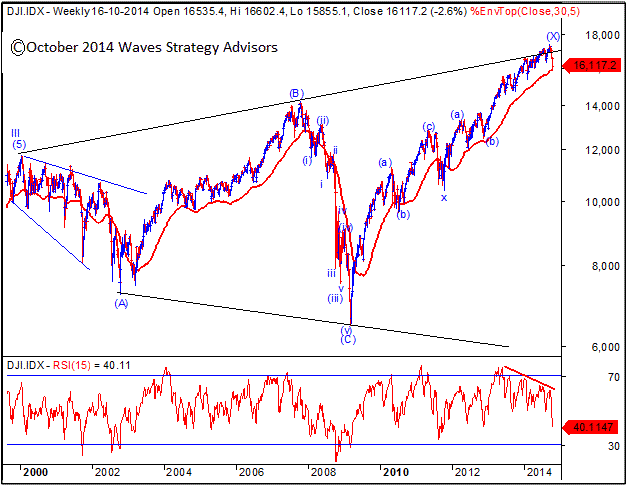
An insight into US major index – DJIA - Global markets have continued to be under turmoil over past few weeks without any strong negative event. It is prudent to look at the long term charts to understand the short term counts when prices reverse from crucial junctures. We are therefore showing the weekly chart of DJIA that represents the entire movement post 2000 onwards.


Elliott Wave Analysis:
As shown, prices have reversed from the important trendline resistance which has been connecting the tops of 2000 and 2007. The recent whipsaw around the same trendline and a sharp move on downside confirms the major trend might be either topping or already topped out.
The up move from 6470 is probably forming primary degree wave (X) that is internally moving in double correction on upside. An X wave connects two standard corrections together. The internal counts of this wave (X) suggest that prices have probably completed intermediate degree wave (c) of second standard correction.
5% Shifted 30 period Exponential Moving average: We have applied 30 period Exponential Moving average but shifted it by 5% which has been acting as very important support and resistance to prices since 2002 onwards. Prices are now kissing this important displaced average line and a decisive close below it will be a strong indication that the intermediate top is in place.
Series of RSI divergences: The turn in prices is accompanied by series of negative divergences on the momentum indicator which is providing secondary negative confirmation. Now a lower low and lower high formation on the weekly scale will be a strong negative indication.
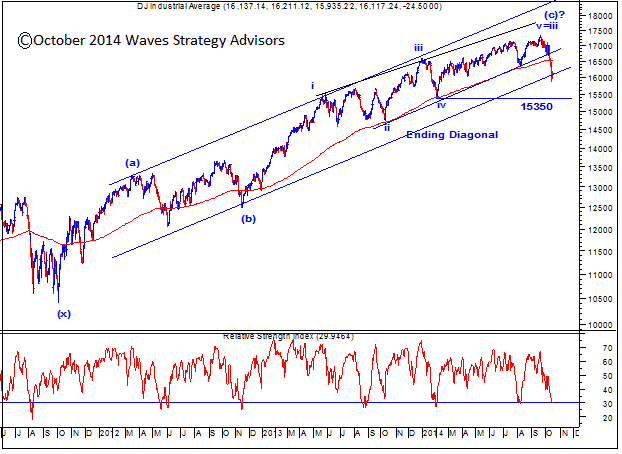
Short term outlook: The daily chart of DJIA shows the rise in form of intermediate wave (c) has been Ending diagonal pattern. UK major index – FTSE has already achieved the downside projection post the breakout from the Wedge pattern. The start of wave (c) on DJIA is from 12500 in late 2012. If the wedge pattern is indeed complete than we can see a sharp selloff across the US stock market. Sharp fall in US treasury yields is also indicating flight to safety.
In short, we are keeping a close watch on US equity markets and a breakdown in DJIA will be a first indication that we are revisiting the 2008 scenario all over again! The most important level is 15350 which is the low of wave iv.
At times it is important to see the Global markets since during period of uncertainty the correlation between various asset classes increases drastically. It will be very crucial to keep an eye on DJIA to gauge the overall momentum across world markets.
