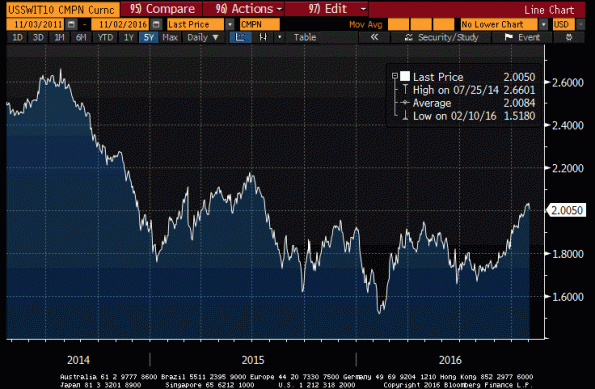
A persistent phenomenon of the last couple of months has been the rise in inflation expectations, in particular market-based measures. The chart below (source: Bloomberg) shows that 10-year inflation swap quotes are now above 2% for the first time in over a year and up about 25-30bps since the end of summer.
The same chart shows that inflation expectations remain far below the levels of 2014, 2013, and…well, actually the levels since 2004, with the exception of the crisis. This is obviously not a surprise per se, since I’ve been beating the drum for months, nay quarters, that breakevens are too low and TIPS too cheap relative to nominals. But why is this happening now? I can think of five solid reasons that market-based measures of inflation expectations are rising, and likely will continue to rise for some time.
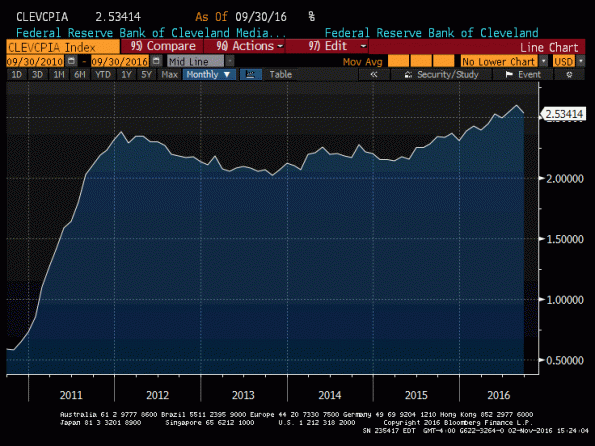
- Inflation itself is rising. What is really amazing to me – and I’ve written about it before! – is that 10-year inflation expectations can be so low when actual levels of inflation are considerably above 2%. While headline inflation oscillates all the time, thanks to volatile energy (and to a lesser extent, food) markets, the middle of the inflation distribution has been moving steadily higher. Median inflation (see chart, source Bloomberg) is over 2.5%. Core inflation is 2.2%. “Sticky” inflation is 2.6%.

Moreover, as has been exhaustively documented here and elsewhere, these slow-moving measures of persistent inflationary pressures have been rising for more than two years, and have been over the current 2% level of 10-year inflation swaps since 2011. At the same time, inflation expectations have been declining. So why are inflation expectations rising? One answer is that investors are now recognizing the likelihood that the inflation dynamic has changed and inflation is not going to abruptly decelerate any time soon.
- It is also worth pointing out, as I did last December in this article, that the inflation markets overreact to energy price movements. Some of this recovery in inflation quotes is just unwinding the overreaction to the energy swoon, now that oil quotes are rising again. To be sure, I don’t think oil prices are going to continue to rise, but all they have to do is to level off and inflation swap quotes (and TIPS breakevens) will continue to recover.
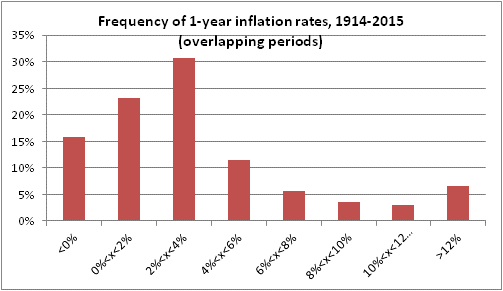
- Inflation tail risk is coming back. This is a little technical, but bear with me. If your best-guess is that inflation over the next 10 years will average 2%, and the distribution of your expectations around that number is normal, then the fair value for the inflation swap is also 2%. But, if the length of the tail of “outliers” is longer to the high side than to the low side, then fair value will be above 2% even though you think 2% is the “most likely” figure. As it turns out, inflation outcomes are not at all normal, and in fact demonstrate long tails to the upside. The chart below is of the distribution of overlapping 1-year inflation rates going back 100 years. You can see the mode of the distribution is between 2%-4%…but there is a significant upper tail as well. The lower tail is constrained – deflation never goes to -12%; if you get deflation it’s a narrow thing. But the upper tail can go very high.
When inflation quotes were very low, it may have partly been because investors saw no chance of an inflationary accident. But it is hard to look at what has been happening to inflation over the last couple of years, and the extraordinary monetary policy actions of the last decade, and not conclude that there is a possibility – even a small possibility – of a long upside tail. As with options valuation, even an improbable event can have an important impact on the price, if the significance of the event is large. And any nonzero probability of double-digit inflation should raise the equilibrium price of inflation quotes.
- The prices that are changing the most right now are highly salient. Inflation expectations are inordinately influenced, as noted above, by the price of energy. This is not only true in the inflation markets, but in forming the expectations of individual consumers. Gasoline, while it is a relatively small part of the consumption basket, has high salience because it is a purchase that is made frequently, and as a purchase unto itself (rather than just one more item in the basket at the supermarket), and its price is in big numbers on every corner. But it is not just gasoline that is moving at the moment. Also having high salience, although it moves much less frequently for most consumers: medical care. No consumer can fail to notice the screams of his fellow consumers when the insurance letter shows up in the mail explaining how the increase in insurance premiums will be 20%, 40%, or more. While I do not believe that an “expectations anchoring” phenomenon is important to inflation dynamics, there are many who do. And those people must be very nervous because the movement of several very salient consumption items is exactly the sort of thing that might unanchor those expectations.
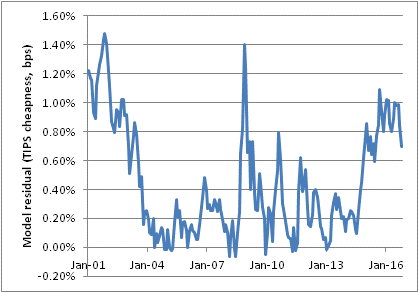
- Inflation markets were too low anyway. When 10-year inflation swaps dipped below 1.50% earlier this year, it was ridiculous. With actual inflation over 2% and rising, someone going short inflation markets at 1.50% had to assess a reasonable probability of an extended period of core-price disinflation taking hold after the first couple of years of inflation over 2%. By our proprietary measure, TIPS this year have persistently been 80-100bps too cheap (see chart, source Enduring Investments). This is a massive amount. The only times TIPS have been cheaper, relative to nominal bonds, were in the early days when institutions were not yet investing in TIPS, and in the teeth of the global financial crisis when one defaulting dealer was forced to blow out of a massive inventory of them. We have never seen TIPS as cheap as this in an environment of at least acceptable liquidity.
So, why did breakevens rally? Among the other reasons, they rallied because they were ridiculously too low. They’re still ridiculously too low, but not quite as ridiculously too low.
What happens next? Well, I look at that list and I see no reason that TIPS shouldn’t continue to outperform nominal bonds for a while since none of those factors looks to be exhausted. That doesn’t mean TIPS will rally – indeed, real yields are ridiculously low and I don’t love TIPS on their own. But, relative to nominal Treasuries (which impound the same real rate expectation), it’s not even a close call.


