The U.S. 10-Year Treasury note is the most recognizable, and most important, debt instrument in the world’s financial system. It is vital to foreign jurisdictions, banks and investors as a way to gain exposure to the U.S. dollar as well as interest payments backed by the full faith and credit of the U.S. federal government. Stateside, the direction of the 10-year yield is highly correlated to the direction of mortgage rates and other popular loans. Lender interest rates tend to rise or fall in concert with the “U.S. 10-year.”
Similarly, a rising yield on the 10-year Treasury often reflects a perception that the future for the U.S. economy is brightening. In contrast, when there are more buyers than sellers of the ever-prominent note – when yields are falling – the economic outlook may be dimming.
Is it that simple? Maybe decades ago. In today’s global investment community, however, central banks such as the Federal Reserve can create demand artificially. The Fed’s quantitative easing (QE) actions – purchasing market-based assets with electronically created currency – pushed yields lower from early May 2009 to early May 2013.
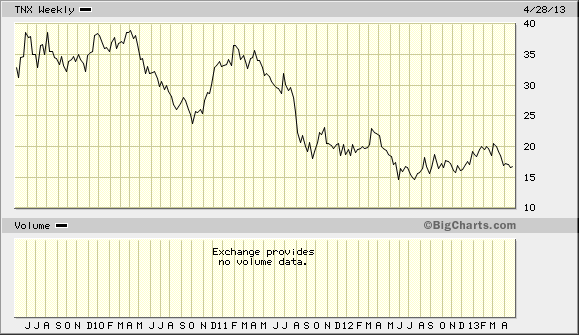
Then came the infamous “taper tantrum.” The Fed had inadvertently signaled an intent in May of 2013 to begin winding down, or tapering, asset purchases over the course of 2014. Short sellers pounced. Bond holders panicked. And the 10-year yield catapulted from the 1.5% level to the 3.0% by year-end 2013. Popular Treasury bond proxies like iShares 7-10 Year Treasury Bond ETF (ARCA:IEF), iShares 10-20 Year Treasury (NYSE:TLH) and iShares 20+ Treasury (ARCA:TLT) promptly lost anywhere from 8%-18% in a matter of eight months.
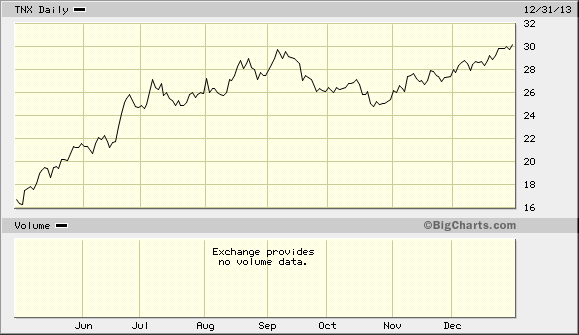
At the end of 2013, virtually every economist on record predicted that Treasuries would continue to lose value and that the 10-year yield would continue to rise. I endorsed an unpopular and completely contrarian point of view that yields would fall. Did I have an inside scoop that the world’s most respected economists didn’t have? Hardly.
I reached a three-pronged conclusion that pointed to a sharp retreat for the yields on longer-term maturities. First, the world economy had been struggling so badly outside the U.S., foreign banks, sovereignties, money managers and investors, would be clamoring for the safer haven and relative value of U.S. Treasury debt. Second, once the shock of the “taper tantrum” subsided, it would become evident to market watchers that the Fed had not stopped buying large quantities of U.S. bonds; they’d still be creating artificial demand throughout 2014. Third, household debt servicing as well as government debt servicing would likely drag on the U.S. economy if somehow – some way – the 10-year yield did not revert to a more viable range (2.0%-2.5%).
So I spent the bulk of 2014 explaining why a barbell portfolio would work wonders for risk-adjusted returns. Did I stick with stocks? Absolutely. The right side of the barbell was chock-full of lower-volatility ETFs such as SPDR Select Health Care (ARCA:XLV), iShares USA Minimum Volatility (NYSE:USMV) and Vanguard High Dividend Yield (NYSE:VYM). The essence of most of my articles, however, dealt with the need for the left-hand side of the barbell. I extolled the virtues of IEF, TLH, TLT and Vanguard Extended Duration (NYSE:EDV). They did not disappoint.
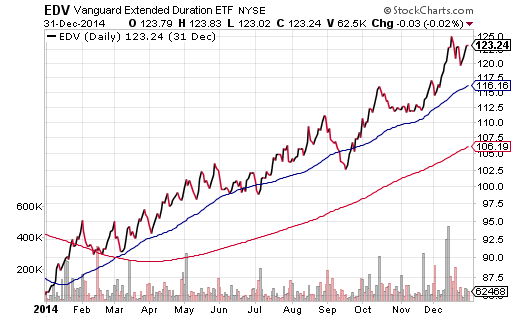
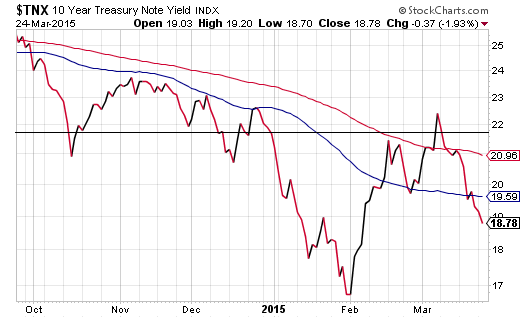
Perhaps ironically, all of the world’s economists signaled a belief that rates would rise in 2015. This time, the 10-year yield is supposed to travel from 2.17% to 2.75%. The belief had been that economic acceleration coupled with mid-year hikes on overnight lending rates would ultimately send yields higher.
St. Louis Fed President James Bullard more or less backed this line of thinking by expressing that another “tantrum” could occur with the central bank looking to raise its target overnight lending rate. Bullard said on Monday:
“We do have some potential for that today because the Fed funds futures path, the market based one, is a lot lower and shallower than the Fed’s actual (summary of economic projections).” he said. “So there is a mismatch there, that is going to have to be reconciled at some point.”
I hate to be blunt, yet, Bullard lacks credibility. When stocks were free-falling towards their first 10% correction in three-plus years – when the S&P 500 was fretting about the end of the Fed’s QE bond purchases at roughly 9.9% off the recent peak – it was James Bullard who told the world (via Bloomberg Business) the Fed could consider delaying the end of bond buying.
From tightening to easing in a blink of an eye? The mere suggestion that the Fed might wait to move was one of the most impressive and powerful indications that the Fed, no matter what its ultimate course, would continue to appease stock and bond investors with extraordinary submissiveness (as needed). The event even earned its own name, the “Bullard Bounce.”
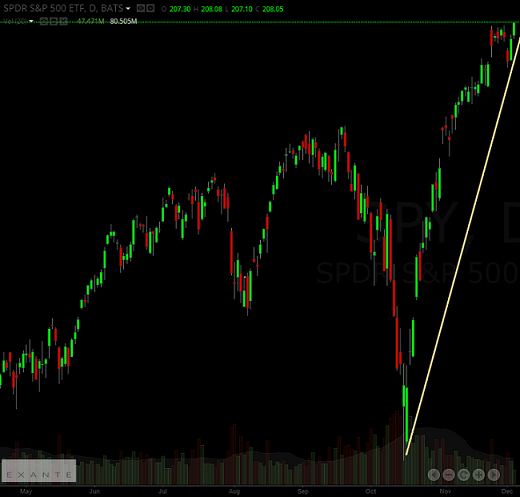
It follows that, once again, I do not see the 10-year spiking to 2.75% by year-end. Nor does it surprise me that the 10-year yield is lower on the year. I still believe that iShares 7-10 Year Treasury (IEF), iShares 10-20 Year Treasury (TLH) and iShares 20+ Treasury (TLT) represent relative value on a global stage where the world is aggressively easing. What’s more, these ETFs can effectively hedge against a sudden stock downtrend, correction or bear.
For those who prefer a multi-asset approach to stock hedging, the FTSE Custom Multi-Asset Stock Hedge Index (MASH Index) incorporates a variety of asset types that tend to perform well in stock sell-offs. The MASH Index includes U.S. bonds like long-term Treasuries and munis, currencies like the U.S. dollar and the Swiss franc, foreign sovereign debt like German bunds as well as precious metals like gold. Over the last 3 months, the MASH Index is up 3.0%, whereas the S&P 500 is up 1.1%.
Disclosure: Gary Gordon, MS, CFP is the president of Pacific Park Financial, Inc., a Registered Investment Adviser with the SEC. Gary Gordon, Pacific Park Financial, Inc, and/or its clients may hold positions in the ETFs, mutual funds, and/or any investment asset mentioned above. The commentary does not constitute individualized investment advice. The opinions offered herein are not personalized recommendations to buy, sell or hold securities. At times, issuers of exchange-traded products compensate Pacific Park Financial, Inc. or its subsidiaries for advertising at the ETF Expert web site. ETF Expert content is created independently of any advertising relationships.
