Surprisingly, markets are treading water here. The dollar, interest rates, and stocks are all oscillating in a narrow range. In some ways, this is surprising. It does not shock me that interest rates are fairly boring right now, with the 10-year yield trading almost exclusively within 25bps of 2% since November. Market participants are divided between those who see the Fed’s cessation of QE as indicative that prices should decline to fair market-clearing levels (that is, higher yields) and those who see weakness economically both domestically and abroad. There is room for confusion here.
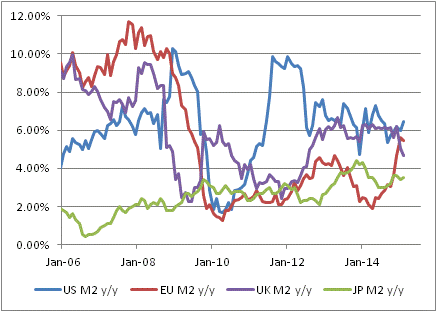
I am similarly not terribly shocked that the dollar is consolidating after a long run, especially when part of that run was fueled by the popular delusion that the Federal Reserve had suddenly become extremely hawkish and would preemptively hike rates before convincing signs of inflation arose. I am hard-pressed to think of a time when the Fed pre-emptively did anything, but that was the popular belief in any event. Now that it is becoming clear that a hike in rates in June is about as likely as the possibility that the Easter Bunny will deliver eggs at the same time, dollar traders who were relying on widening interest rate differentials are pausing to take stock of the situation. I will say that it certainly seems plausible to me that the dollar’s rally will continue for at least a little while, due to the volatility coming our way as the Greek drama plays out, but the buck is not an automatic buy either. Money growth in the U.S. continues to outpace money growth in most other economies (see chart, source Bloomberg), although it is a much closer thing these days.
An increase in relative supply, if the demand curves are similar, should provoke a decrease in relative price. Unless you believe that the Fed isn’t just going to increase rates but is also going to shrink its balance sheet so that money growth abates eventually, it is hard to envision the dollar launching continuously higher. More likely is that as more and more currencies see their supplies increase, the exchange rates meander but the whole kit-and-kaboodle loses ground to real assets.
One of those real assets is housing. An underpinning to my argument, for several years running now, that core prices were not going to be deflating any time soon was the observation that housing prices (and hence rents, with a lag) have been rising rapidly once again. The deceleration in the year/year growth rates in 2014 was a positive sign, but the increase in prices in 2012 and 2013 is still pressing rents higher now and any sag in rents is yet to be felt. However, today’s release of FHA price index data as well as the Existing Home Sales report suggests that it is premature to expect this second housing bubble to unwind gently. The chart below is the year/year change in the median price of existing homes (source: Bloomberg). The recent dip now seems to have been an aberration, and indeed the slowdown in 2014 may have merely presaged the next acceleration higher.
And that bodes ill for core (median) price pressures, which have been steady around 2.2% for a while but may also be readying for the next leg up. Review my post-CPI summary for some of the fascinating details! (Well, fascinating to me.)
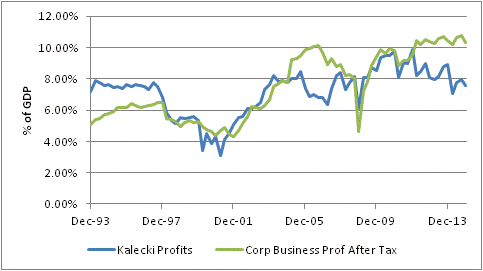
This doesn’t mean that I am sanguine about growth, either domestic or global, looking forward. I thought we would get out of 2014 without a recession, but I am less sure about 2015. Europe is going to do better, thanks to weaker energy and a weaker currency (although the weaker currency counteracts some of the energy weakness), but the structural problems in Europe are profound and the exit of Greece will cause turmoil in the banks. But US growth is in trouble: the benefit from lower energy prices is diffuse, while the pain from lower energy prices is concentrated in a way it hasn’t been in the past. And the dollar strength pressures company earnings, as we have seen, on a broad basis. And that’s where it is a little surprising that we are seeing water-treading. It gets increasingly difficult for me to figure out what equity buyers are seeing. Profits are flattening out and even weakening, and they are already at a very high level of GDP so that any economic weakness is going to be felt in profits directly. Furthermore, I find it very interesting that the last time actual reported profits diverged from “Kalecki Profits” corresponded to the last equity bubble (see chart, source Bloomberg).
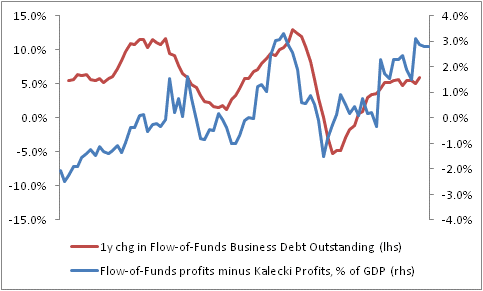
“Kalecki Profits” is a line that computes corporate profits as Investment minus Household Savings minus Government Savings minus Foreign Savings plus Dividends. Look up Kalecki Profit Equation on Wikipedia for a further explanation. The “Corp Business Prof After Tax” is from the Federal Reserve’s Flow of Funds Z.1 report and is measured directly. The implication is that if companies are reporting greater profits than the sum of the whole, then the difference is suspect. For example, leverage: by increasing financial leverage, the same top line creates more of a bottom line (in either direction). The chart below (source: Federal Reserve; Enduring Investments analysis) plots the 1-year percentage change in business debt outstanding (lagged 2 quarters to center it on the year in question) versus the difference between the two lines in the prior chart.
We might call this “pretty cool,” but in econometrics terms this is merely an explanatory relationship. That is, it doesn’t really help us other than to help explain why the two series diverge. It doesn’t, for example, tell us whether Kalecki profits will converge upwards to reported profits, or whether reported profits will decline; it doesn’t tell us whether it is a decline or deceleration in business debt outstanding that prompts that convergence or whether something else causes both things to happen. I think it’s unlikely that the divergence in the two profit measures causes the change in debt, but it’s possible. I will say that this last chart makes me more comfortable that the Kalecki equation isn’t broken, but merely that it isn’t capturing everything. And my argument, for what it is worth, would be that business leverage cannot increase without bound. At some point, business borrowing will decline.
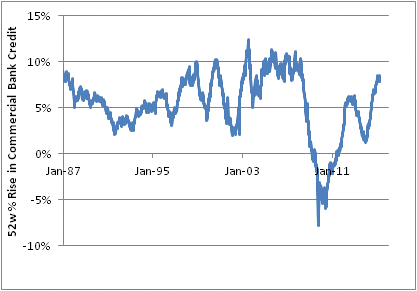
It does not look like that is happening yet. I have been reading recently about how credit officers have been declining credit more frequently recently. That may be true, but it isn’t resulting in slower credit growth. Commercial bank credit growth, according to the Fed’s H.8 report and illustrated below, continues to grow at the fastest y/y pace since well before the crisis.
If credit officers are really declining credit more often than before, it must mean that applications are up, or that the credit is being extended on fewer loans (that is, to bigger borrowers). Otherwise, we can’t square the fact that there’s rapid credit growth with the proffered fact that credit is being declined more often.
There is a lot to sort through here, but the bottom line is this: I have no idea what the dollar is going to do. I am not sure what the bond market will do. I have no idea what stocks will do. But, if I have to invest (and I do!), then in general I am aiming for real assets and avoiding financial assets.


