I don’t have a specific chart I wanted to focus on today but I did want to take a timeout and look at where we’ve come and where things stand as we finish up Q3.
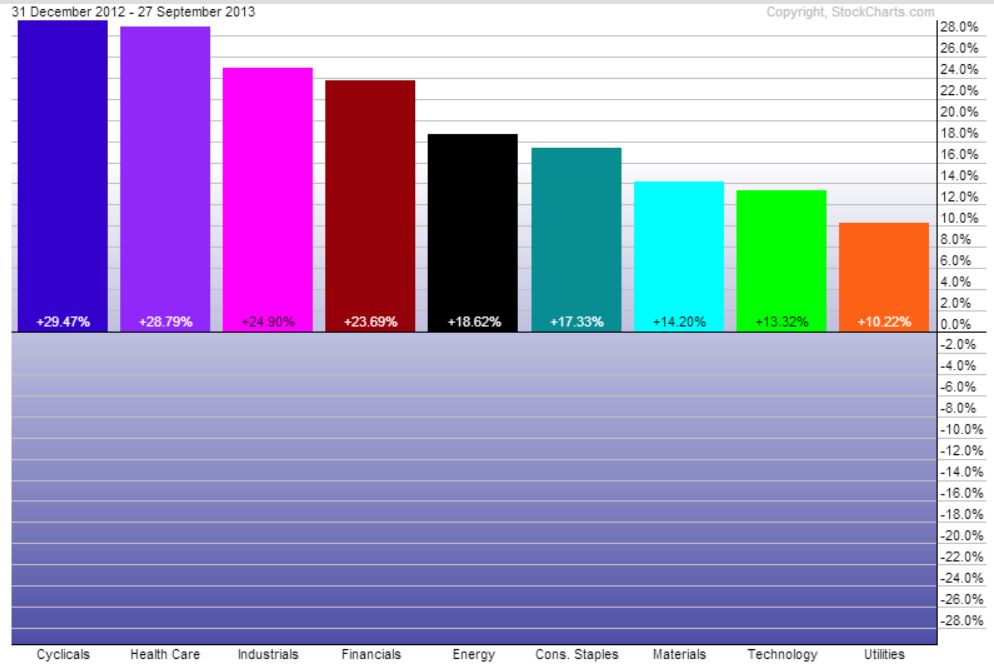
For the first nine months of 2013 the best performing sectors have been the cyclicals (XLY), health care (XLV), and industrials (XLI). With utilities (XLU) and tech (XLK) bringing up the rear. It seems when dividend paying stocks took their hit earlier this year, utilities were unable to climb back from the hole in which they fell.
Okay, so we know where the money has been flowing as far as sectors go, but what about the S&P 500 (SPX) and the recent bout of weakness. While we saw stocks gap down this morning over the Breaking Bad finale fears of the government shutting down, will buyers step in? This was the question I addressed for MarketWatch, here’s what I said:
Also in the let’s-not-dive-in-now camp, Financial Enhancement Group’s Andrew Thrasher says it’s still “no-man’s land” for stocks until he sees some market internals getting overextended to the downside, such as the number of advancing and declining stocks, option activity, volume levels etc.
“In the dips we saw in June and August, the S&P 500 tested its 100-day moving average as support, I also was seeing signs of possible mean-reversion as traders became too over-positioned on the sell side. I’m not seeing that in stocks yet,” says Thrasher.
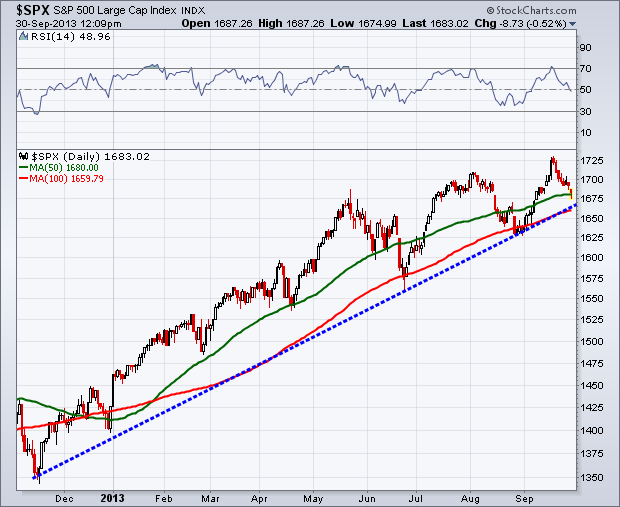
It’s not too much of a surprise to see bottom feeders step in as we test the 50-day moving average, but I’m not completely sold we’ve seen an extreme in selling quite yet… but maybe we did today, I’ll have a better grasp on that after the close when I can digest the price action and market internals. I’m not an intraday trader nor do I play one on TV.
Here’s what I see in the big picture… The up trend off (blue dotted line) the closing low from last November is still in tact. We almost got a break in late-August, but buyers were able to step in before the damage was done. Today the battle will be over the 50-day moving average (green line). During the past two dips we found support at the 100-MA (red line), it’ll be interesting to see if we get another test in the coming week(s). So from a trend trading perspective, things still look rosy, higher lows and higher highs and we’ll cal it a day. But I try to view things through multiple lenses, and I still can’t shake the comparison I wrote about concerning whether 2013 was shaping up to be like 2007. However, I’ll let price confirm the speculation before I take action. 
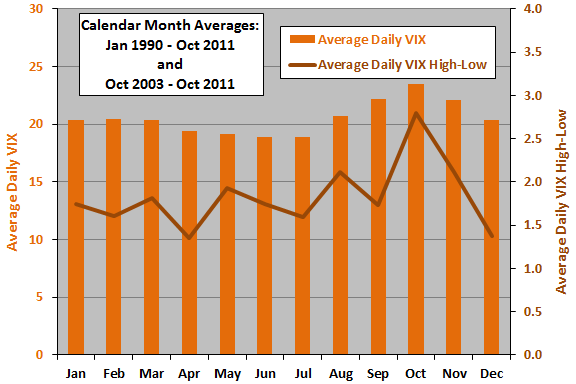
So we prepare to close up September 2013 and with it, the third quarter. What do the history books say about October? As Josh Brown noted over the weekend, October is one of the most interesting months both for its increase in volatility and its historical importance from previous market tops and bottoms. The below chart is from CXO Advisory (h/t Josh) and shows the seasonal volatility going back to 1990. As you can see, October shapes up to be one of the more volatile months with the highest historical average daily VIX reading.
Going forward we unfortunately must contend with the possible government shutdown and the debt ceiling. We’ll see if this is enough to finally break the up trend. Price will lead the way.
Disclaimer: Do not construe anything written in this post or this blog in its entirety as a recommendation, research, or an offer to buy or sell any securities. Everything in this post is meant for educational and entertainment purposes only. I or my affiliates may hold positions in securities mentioned in the blog. Please see my Disclosure page for full disclaimer.
- English (UK)
- English (India)
- English (Canada)
- English (Australia)
- English (South Africa)
- English (Philippines)
- English (Nigeria)
- Deutsch
- Español (España)
- Español (México)
- Français
- Italiano
- Nederlands
- Português (Portugal)
- Polski
- Português (Brasil)
- Русский
- Türkçe
- العربية
- Ελληνικά
- Svenska
- Suomi
- עברית
- 日本語
- 한국어
- 简体中文
- 繁體中文
- Bahasa Indonesia
- Bahasa Melayu
- ไทย
- Tiếng Việt
- हिंदी
Where We Stand As We Close Out September
Published 10/01/2013, 02:36 AM
Updated 07/09/2023, 06:31 AM
Where We Stand As We Close Out September
Latest comments
Install Our App
Risk Disclosure: Trading in financial instruments and/or cryptocurrencies involves high risks including the risk of losing some, or all, of your investment amount, and may not be suitable for all investors. Prices of cryptocurrencies are extremely volatile and may be affected by external factors such as financial, regulatory or political events. Trading on margin increases the financial risks.
Before deciding to trade in financial instrument or cryptocurrencies you should be fully informed of the risks and costs associated with trading the financial markets, carefully consider your investment objectives, level of experience, and risk appetite, and seek professional advice where needed.
Fusion Media would like to remind you that the data contained in this website is not necessarily real-time nor accurate. The data and prices on the website are not necessarily provided by any market or exchange, but may be provided by market makers, and so prices may not be accurate and may differ from the actual price at any given market, meaning prices are indicative and not appropriate for trading purposes. Fusion Media and any provider of the data contained in this website will not accept liability for any loss or damage as a result of your trading, or your reliance on the information contained within this website.
It is prohibited to use, store, reproduce, display, modify, transmit or distribute the data contained in this website without the explicit prior written permission of Fusion Media and/or the data provider. All intellectual property rights are reserved by the providers and/or the exchange providing the data contained in this website.
Fusion Media may be compensated by the advertisers that appear on the website, based on your interaction with the advertisements or advertisers.
© 2007-2024 - Fusion Media Limited. All Rights Reserved.
