"The risk is that we have all of a sudden a very quick and sharp decline because what happened in China resembles in some degree what happened in the late-1990s in Asia... If the markets realize that this could be a big problem, we could have a big wave of selling."
-Felix Zulauf speaking to Financial Sense listeners on August 18th, days before the recent market crash
Given the recent sharp decline in the market, the overwhelming question from clients is whether this is the beginning of a new bear market similar to 2000-2002 or 2007-2009. Though I don’t think we are quite there yet, here is the big picture outlook as I see it with possible risks laid out further below.
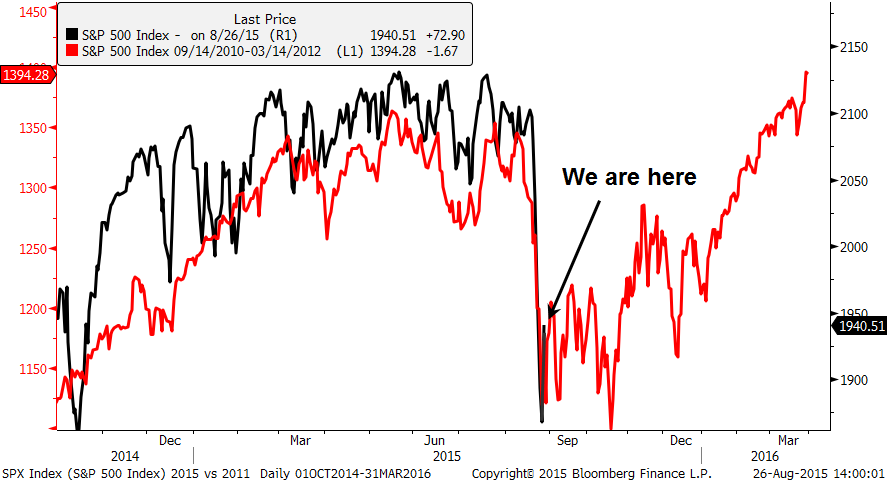
If I am correct and this is not yet the beginning of a new bear market, then we are likely to see a recovery rally (which is underway as I write this) with further volatility heading into year-end. A possible scenario could be something similar to what we experienced in 2011 (see below - keep in mind, past performance does not guarantee future results). In this case, it took several months for the S&P 500 (2015 in black, 2011 in red) to stabilize and digest new information before ultimately heading higher.
In 2011, several significant events served as the catalyst for a market bottom: a Greek bailout to arrest European debt fears, the U.S. Congress voting to raise the debt ceiling, and the Fed’s Operation Twist.
What might cause the market to stabilize and/or bottom in the months ahead this time around? There are several things we should anticipate for this to play out: U.S. economic data justifying a short-term Fed rate hike in December, continued rate cuts and other stimulatory measures out of China and a pickup in global growth.
According to a wide range of leading economic data, near-term risks of a major slowdown or recession in the U.S. are still low. Also, market strategists and China watchers recognize that Chinese officials have yet to exhaust their full arsenal of policy tools should uncertainty arise. However, it is the last point — a pickup in global growth — that probably seems the most unlikely to investors currently.
In response to the current economic slowdown, countries around the globe have cut interest rates at a swift and dramatic pace. Almost every central bank except the U.S. Fed and Bank of England are now easing, which means global monetary policy has become highly stimulative. With such a dramatic and coordinated effort, there is good reason to expect this will provide a tailwind for global markets and help arrest deflationary pressures.
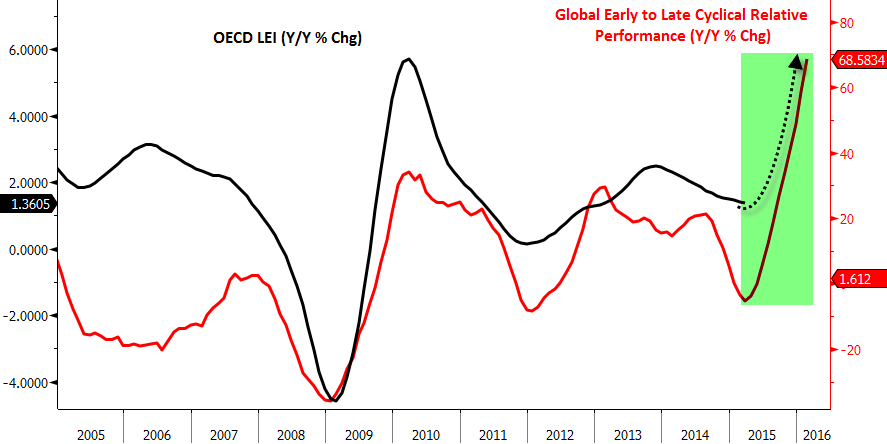
Another indicator I often cite that is widely followed by many macro-oriented strategists and research firms is the relative performance of early cyclicals (i.e. global consumer stocks) to late-stage cyclicals (i.e. energy, industrials, and materials), which leads the OECD leading economic index by six months. This too is arguing for a pickup among global OECD countries.
Risks:
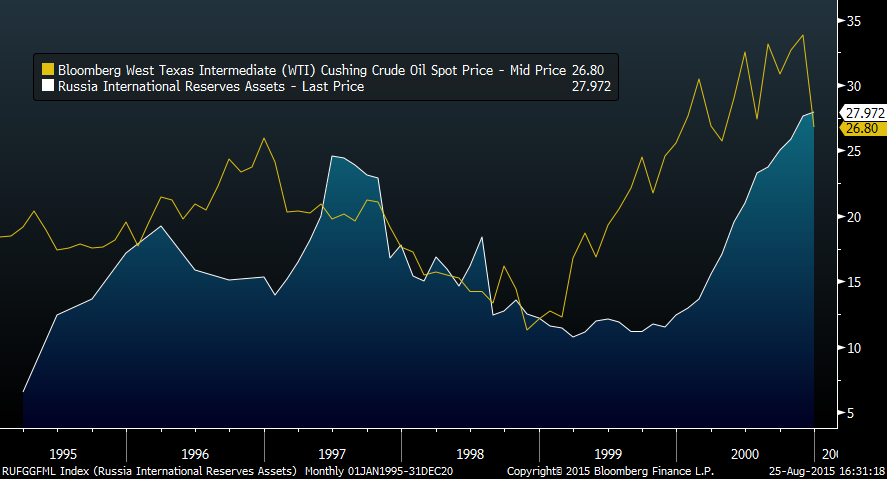
When it comes to China, we could be dealing with a similar situation to the 1998 Russian ruble crisis. Then the ruble fell 70% in August/September which caused a global sell-off and the S&P 500 fell roughly 20%.
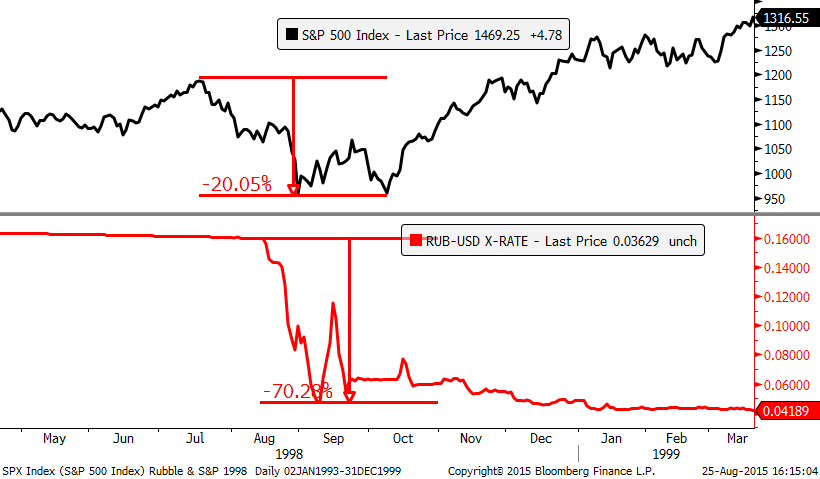
Back then Russia was a very small portion of global growth, BUT its currency collapsed by 70% and brought down many global players who were leveraged like LTCM.
China, however, is the second largest economy in the world so it doesn’t need to see a 70% currency collapse to create a global financial shock. Just as there was a 1-2 week delay before the fall in the ruble disrupted U.S. markets, the ripple effects of the recent yuan devaluation took about a week for the S&P 500 to react.
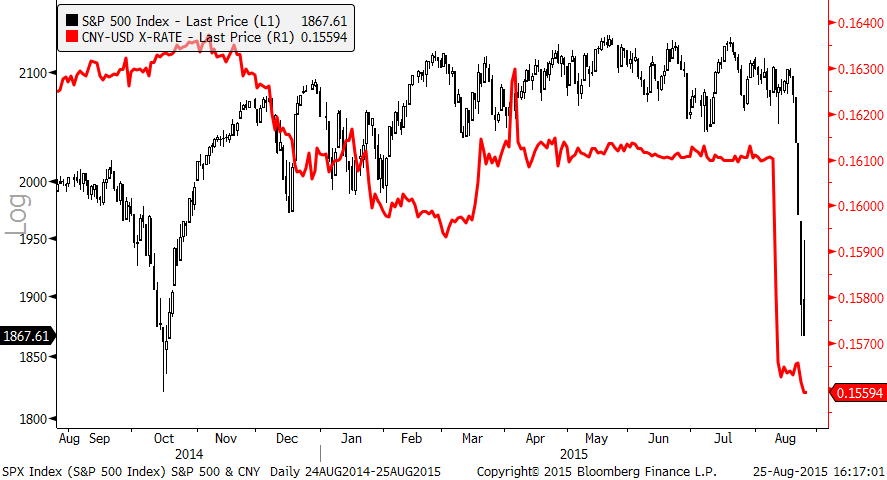
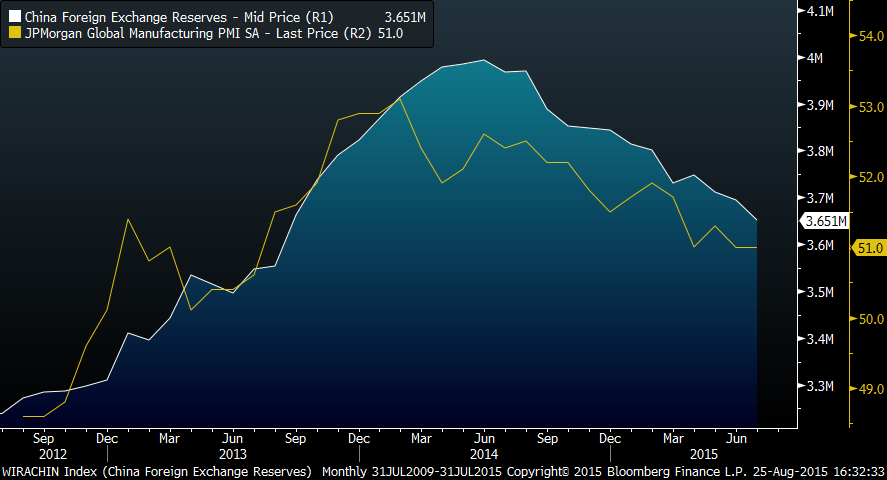
Since last year, China has been using its massive foreign currency reserves to defend its peg with a strengthening U.S. dollar (by selling foreign currencies and buying renminbi), which has led its reserves to decline by nearly $400B in USD.
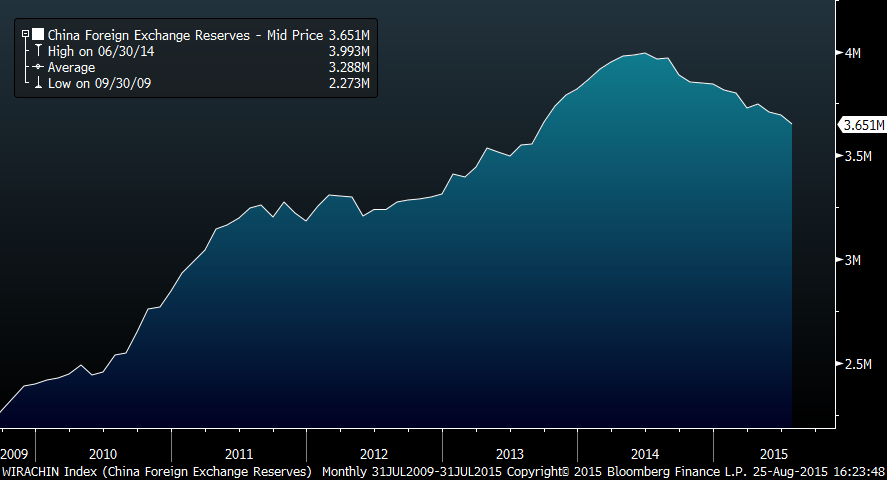
In order to prevent their reserves from plummeting too far they decided to stop defending the currency to offset global capital fleeing China and let their currency fall.
This is following the script of the Russian 1998 crisis in which Russian foreign currency reserves peaked in 1997 and fell 56% into 1999 before the currency collapse stimulated exports and brought their trade and financial accounts into equilibrium.
Unlike Russia, I do not believe that the Chinese currency needs to see a massive devaluation in order to arrest its balance of payments crisis (Reference 1, Reference 2) and could have a much smaller devaluation on the order of 10-20% on a longer timeframe, as Zulauf predicts. In the case of Russia, foreign exchange reserves fell along with oil prices given their oil export dependency, then improved after oil prices rose (in yellow) and their currency declined.
Like Russia's tie to oil, China is very sensitive to global economic activity and its foreign currency reserves (white line) closely track JP Morgan’s global manufacturing PMI (yellow line). If global economic activity picks up as I expect in the coming months we are likely to see Chinese reserves begin to build and its balance of payments crisis to subside.
However, if I am wrong and global growth does not pick up, China may indeed see a larger devaluation over the near-term and we could be in for a more protracted corrective period. This could be a tricky and volatile market just as it was in 1998 and in 2011, but I believe, ultimately, when the current rout ends, we will see new highs in the stock market later in the year or at the latest in early 2016. Global central banks are already in a coordinated easing mode and, in light of the current weakness, may respond even more forcefully to push the bull market higher for one last leg.
If this outlook holds true, I believe we should see a bit more volatility in the months ahead before a final blow-off top later in 2016 or, perhaps at the latest, 2017.
For further background on China, their recent currency devaluation, and the possible implications this will have on the market, I highly encourage those who have not done so already to listen through some of the recent China-focused broadcasts we’ve conducted starting with the very timely 48-minute interview we did last week with Felix Zulauf. As quoted in the very beginning of this article, Felix warned Financial Sense listeners that China’s devaluation raised the risk of “a very quick and sharp decline” and that we could see “a big wave of selling” just days before the large sell-off took place.
