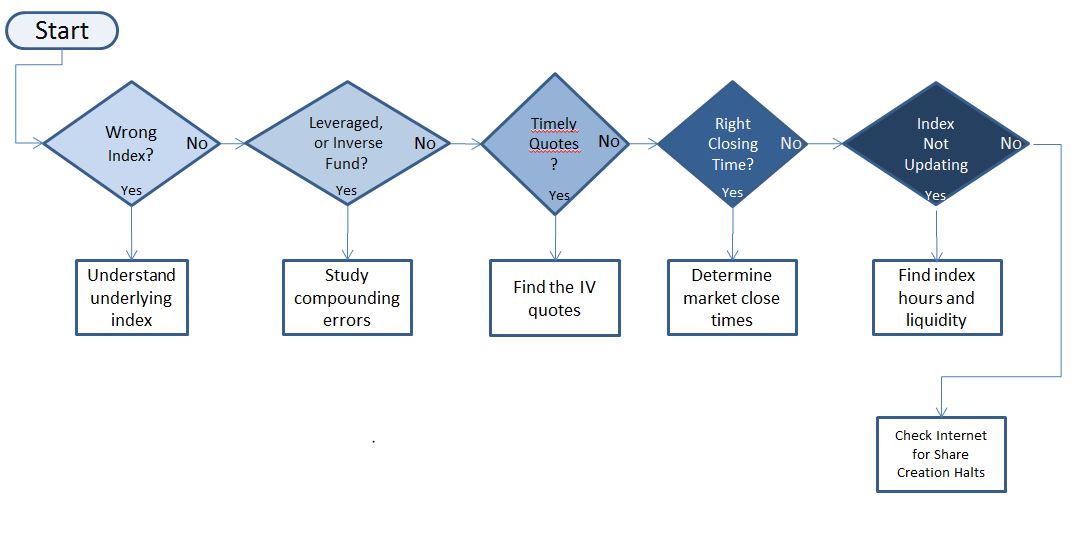
Frequently I see people complaining that their Exchange Traded Fund (ETF) or Exchange Traded Note (ETN) is broken. Occasionally they’re right, but most of the time they’re not. Before complaining, here are some things to look at:
- Are you looking at the right index?
- All Exchange Traded Products (ETPs) track an index, which is identified in their prospectus, and in the fund’s fact sheet. Don’t assume what the index is. For example, the index that VXX tracks is not the CBOE’s VIX® , and UVXY the 2X volatility fund is not designed to track 2X the VIX.
- None of the volatility funds track the VIX, they all use other indexes, because the VIX itself is not investable. Some funds (e.g., UVXY, CVOL) do a semi-decent job of tracking the VIX in the short term, but nobody does a good job in the medium to long run. In fact it’s a killing field.
- Investigate the index once you’ve determined what it is. It’s often not easy; sometimes even getting quotes on indexes is hard. But similar to the hunter’s credo of eating what they kill, investors should understand what they trade.
- Is the fund leveraged/geared (e.g., 2X, 3X), or an inverse fund?
- Leveraged or inverse funds typically do a good job of delivering their target performance on a daily basis, but usually fall far short with longer time frames. The reason is compounding error, or path dependency. It erodes the value of these funds in choppy markets.
- For example if a non-leveraged fund (e.g., SPY) goes up 10% one day and down 9.09% the next it ends up even. However the 2X fund (SSO) and the inverse fund (SH) both end up down 1.8%
- 2X Fund: (10*(2*10%)=12, 12*(2*-9.09%) = 9.82
- -1X Fund: (10* (-10%) =9, 9 *(+9.09%) = 9.82
- In strongly trending markets compounding errors can boost the return of a leveraged / inverse fund beyond its multiplier.
- What are the timestamps of the quotes you are looking at?
- Unless your fund is very active the quote you’re using might be older than you think. For example the fund’s closing value might reflect a trade that happened hours before market close. If you look at an intra-day chart of your fund including volume you should be able to see when the trades occurred and the quotes updated. Typically the intraday indicative value (“IV”) quote is a more accurate way of getting the actual fund value. It’s updated every 15 seconds during market hours.
- The IV quote tickers are not standardized. Yahoo finance uses a “^” prefix and a “_IV” suffix to get the IV value (e.g., ^VXX_IV).
- Are the markets you’re comparing closing at the same time?
- VIX futures markets at the CBOE Futures exchange trade for 15 minutes after the equities markets close. The volatility ETPs are based on volatility indexes that are based on futures settlement values—so their IV value at 4:15 ET is the real closing value for the volatility funds.
- Is the trading value of the funds diverging significantly from its index or IV value?
- If this is the case, your fund might be broken, but before we pursue that there are a couple thing to check:
- Are the markets for the underlying assets closed (e.g., Asian or European stocks)? If so those indexes can’t update so some divergence during USA trading hours should be expected.
- Are the securities for the underlying assets illiquid or rarely traded (e.g., high yield corporate bonds)? If so the trading value might reflect the market’s estimation of what those assets are worth, rather than the last trade, or published bid/ask quotations.
- If this is the case, your fund might be broken, but before we pursue that there are a couple thing to check:
- Market closures (e.g., the Egyptian stock market closed for 2 months in 2011 which had a serious effect on the Market Vectors Egypt Index ETF (EGPT)
- Regulatory hurdles, where permission to issue new shares is delayed the United States Natural Gast ETF (UNG), United States 12 Month Natural Gas ETF (UNL), United States Short Oil ETF (DNO_
- Issuer “internal limits on the size of ETNs”, VelocityShares Daily 2x VIX ST ETN (TVIX)
- Commodity position limits, where the exchanges won’t allow the funds to accumulate more contracts, UNG
- Self-imposed market cap limits, JPMorgan Alerian MLP Index ETN (AMJ)
NYSE EURONEXT has a good webpage that lists all the funds that currently have suspended or put limits on share creation.
Credit Suisse’s TVIX has restarted limited share creation processes, but its requirements are so expensive the market makers still allow the fund to climb as much as 15% higher than its IV value—I consider that broken.
