Given the recent rally in the broad market, it’s a good time to take a updated look at the technical-resistance levels in the major indices. Specifically, let’s assess how much room the main stock-market indexes have to run before running into resistance. We’ll use the long-term monthly chart interval, which gives a comprehensive view of the “big picture” in the stock market.
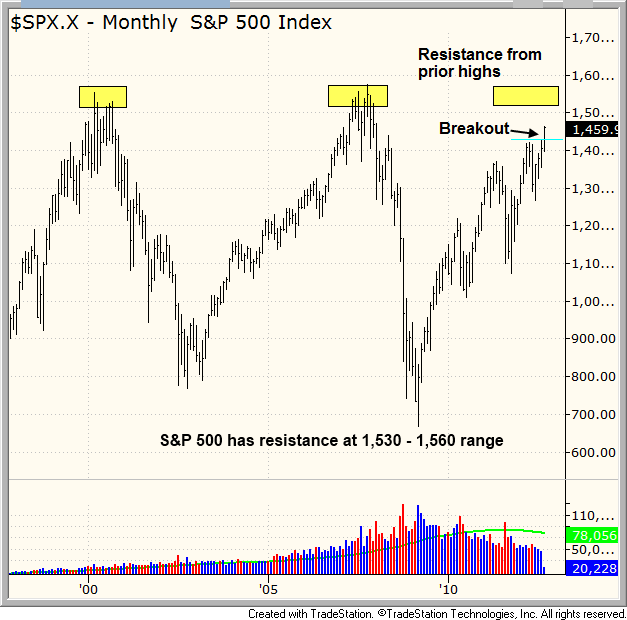
The S&P 500 (SPX) monthly has a bit of room to run before hitting resistance of prior highs. The prior highs are obvious levels of resistance, so the current rally could easily “overcut” those highs before stalling out:
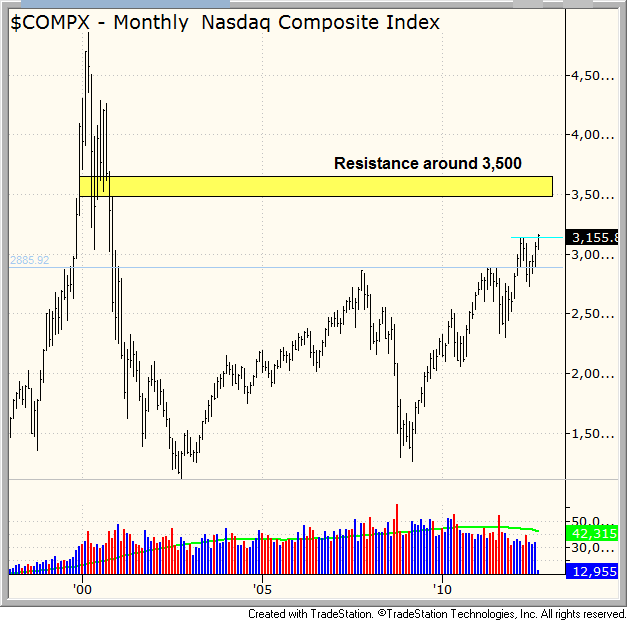
Unlike the S&P 500, the resistance is not as concrete with the Nasdaq Composite (COMPX), as it has never fully recovered after selling off from the highs in 2000. There may be some major long-term resistance at the 3,500 level, but most market players who wanted out of the market on the decline are already gone by now. Therefore, we do not consider that to be a big level of resistance.
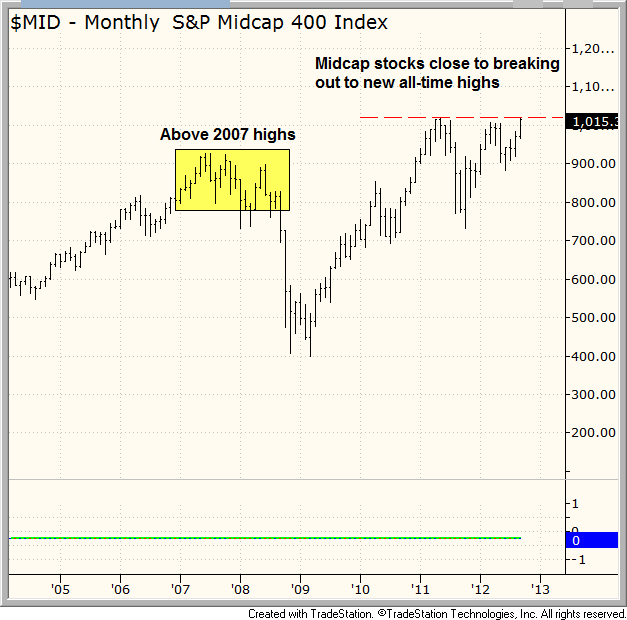
The S&P Midcap 400 (MID) is in the best shape of all the major averages. The monthly chart has already cleared the prior highs of 2007 and is poised to breakout to new all-time highs should the current market rally remain healthy. Midcap stocks have lagged the S&P 500 throughout most of 2012, but have outperformed big cap stocks the past few weeks.
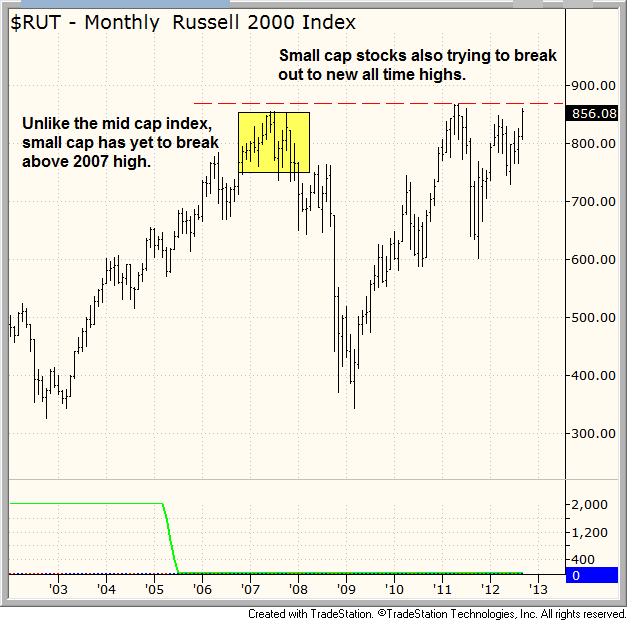
The small cap Russell 2000 (RUT) is also closing in on all-time highs. We prefer to see small and midcap stocks lead the market higher, which indicates that institutions are willing to take on risk.
The broad market rally continues to pick up steam with more industry sectors and ETFs participating in the advance. The financial sector has picked up some momentum the past few weeks, with the Financial Select SPDR ETF (XLF) breaking out from a six-month base on Thursday. Although there are plenty of negatives out there to keep traders from investing in this market, we prefer to focus on the price and volume action of individual trade setups and to trade what we see, not what we think.
Original post
- English (UK)
- English (India)
- English (Canada)
- English (Australia)
- English (South Africa)
- English (Philippines)
- English (Nigeria)
- Deutsch
- Español (España)
- Español (México)
- Français
- Italiano
- Nederlands
- Português (Portugal)
- Polski
- Português (Brasil)
- Русский
- Türkçe
- العربية
- Ελληνικά
- Svenska
- Suomi
- עברית
- 日本語
- 한국어
- 简体中文
- 繁體中文
- Bahasa Indonesia
- Bahasa Melayu
- ไทย
- Tiếng Việt
- हिंदी
When Will Major Indices Hit Resistance?
Published 09/14/2012, 10:35 AM
Updated 07/09/2023, 06:31 AM
When Will Major Indices Hit Resistance?
3rd party Ad. Not an offer or recommendation by Investing.com. See disclosure here or
remove ads
.
Latest comments
Install Our App
Risk Disclosure: Trading in financial instruments and/or cryptocurrencies involves high risks including the risk of losing some, or all, of your investment amount, and may not be suitable for all investors. Prices of cryptocurrencies are extremely volatile and may be affected by external factors such as financial, regulatory or political events. Trading on margin increases the financial risks.
Before deciding to trade in financial instrument or cryptocurrencies you should be fully informed of the risks and costs associated with trading the financial markets, carefully consider your investment objectives, level of experience, and risk appetite, and seek professional advice where needed.
Fusion Media would like to remind you that the data contained in this website is not necessarily real-time nor accurate. The data and prices on the website are not necessarily provided by any market or exchange, but may be provided by market makers, and so prices may not be accurate and may differ from the actual price at any given market, meaning prices are indicative and not appropriate for trading purposes. Fusion Media and any provider of the data contained in this website will not accept liability for any loss or damage as a result of your trading, or your reliance on the information contained within this website.
It is prohibited to use, store, reproduce, display, modify, transmit or distribute the data contained in this website without the explicit prior written permission of Fusion Media and/or the data provider. All intellectual property rights are reserved by the providers and/or the exchange providing the data contained in this website.
Fusion Media may be compensated by the advertisers that appear on the website, based on your interaction with the advertisements or advertisers.
© 2007-2024 - Fusion Media Limited. All Rights Reserved.
