Highlights
· Market movers: Weekly technical outlook
· US dollar: What’s behind the world reserve currency’s disappointing performance
· Look ahead: Stocks
· Look ahead: Commodities
· Global data highlights
Market movers: Weekly technical outlook
Technical Developments:
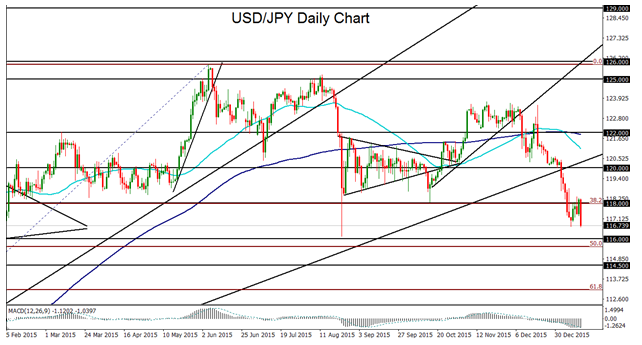
· USD/JPY remains pressured by plunging global stock markets and could be poised for further losses in the event of continued equity market volatility. Technical bias: Neutral to Moderately Bearish
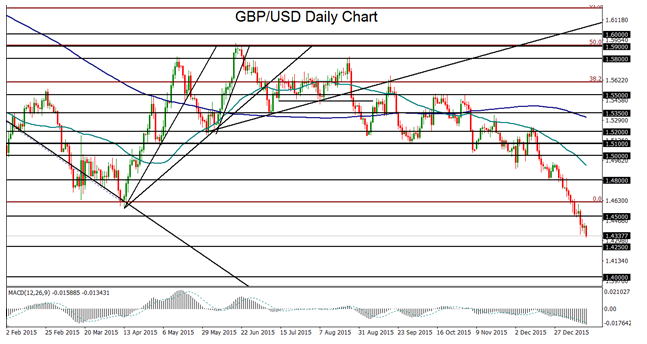
· GBP/USD has continued to fall sharply due in part to a dovish Bank of England, and is potentially targeting new multi-year lows. Technical bias: Bearish
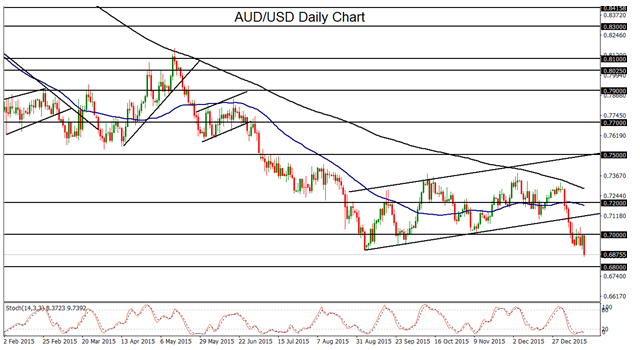
· AUD/USD has hit a new long-term low on persistent turmoil in China’s financial markets, and has confirmed a continuation of its longstanding bearish trend. Technical Bias: Moderately Bearish
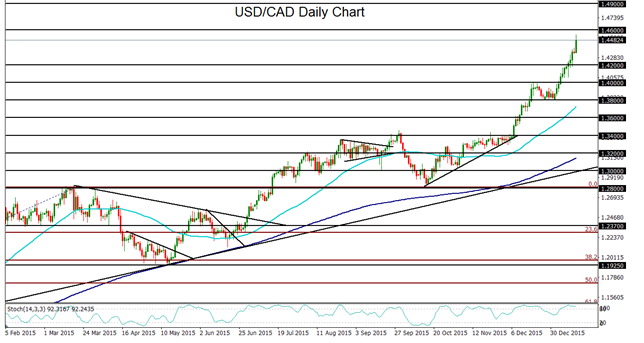
· USD/CAD has continued to rise sharply on plunging crude oil prices, and could be poised for further gains as oil prices remain depressed due to incessant oversupply. Technical bias: Bullish
USD/JPY
USD/JPY spent much of this past week rising moderately as global equity markets regained some measure of stability following a highly volatile beginning of the new year. This changed dramatically on Friday, as falling stock markets around the world were pressured further by plunging crude oil prices. This resulted in a flight to the safe haven Japanese yen, which rose considerably against most other currencies. This yen surge could readily be seen on the USD/JPY chart. For much of the week, the currency pair had been rising in a rebound from its lows, and had climbed slightly above the key 118.00 level by late Thursday. Friday, however, saw a steep plunge below 118.00 to drop below the most recent low of 116.68 that was hit in the beginning of the week. With stock market volatility not likely to be over yet, further losses could well be in store for USD/JPY. With sustained trading below the noted 118.00 resistance level, the next major downside targets are at the key 116.00 and then 114.00 support levels.
GBP/USD
GBP/USD remained sharply bearish this past week, continuing the steep plunge that has been in place for a month, since mid-December. This month’s plunge has represented an acceleration of the bearish trend that has been in place for the past half year. The Bank of England’s rather dovish monetary policy summary on Thursday cast further doubts on the potential for a UK rate hike this year, thereby placing additional pressure on GBP/USD. Friday saw the currency pair hit a new 5½-year low just above 1.4300. With continued weakness under the key 1.4500 resistance level, the next major downside targets are at the 1.4250 support area and the 1.4000 psychological support level.
AUD/USD
AUD/USD spent most of this past week in a tight consolidation below key resistance around the 0.7000 psychological level and just above its September multi-year low. This changed on Friday as the commodity currency plummeted to a new 6+ year low below 0.6900 on renewed volatility in China. This latest sharp drop confirms a continuation of both the short-term downtrend that has been in place since the very beginning of the new year as well as the long-term downtrend that has been in place for the past several years. Continued volatility in China’s financial markets and economic growth prospects should likely continue to place pressure on the China-linked Australian dollar. With sustained trading below the noted 0.7000 level, the next major downside targets are at the key 0.6800 and 0.6500 support levels.
USD/CAD
USD/CAD has continued its relentless rise as the US dollar has remained supported and the energy-correlated Canadian dollar has been continuously hit by plunging crude oil prices. This has resulted in a sharp rise for the currency pair that has consistently reached and exceeded progressively higher target levels. Most recently, since the beginning of the year, USD/CAD has surged unyieldingly to breakout above the major 1.4000 and 1.4200 resistance levels. With little respite in sight for oversupplied crude oil, it is difficult to foresee any true recovery in oil prices for the medium-term, beyond just limited oversold bounces and short-seller profit-taking. Therefore, the outlook for the Canadian dollar remains rather bleak, and the USD/CAD currency pair should likely continue to trade within its longstanding bullish trend. With sustained trading above 1.4200, the next major upside targets are at the 1.4600 and then 1.4900 resistance levels.
US dollar: What’s behind the world reserve currency’s disappointing performance
It was another disappointing week for risk asset bulls. After showing signs of stabilizing early in the week, global stocks (led by Chinese equities) dropped off the map on Friday as concerns about the oil market once again spooked traders. Some of the world’s most important equity markets, including the S&P 500, FTSE, DAX, Nikkei, and Shaghai Composite, are all testing key medium-term support levels as of writing, so a bounce is certainly possible in the coming week. Regardless of what global equities do though, the bigger story might be that the world’s reserve currency has dropped the ball in what should have been a perfect environment for the US dollar rally.
As we go to press, the “safe haven” US dollar index is trading near 98.60, essentially unchanged from last week’s close of 98.40. With market volatility shooting through the roof and global economic concerns elevated, why haven’t traders rushed to the perceived safe haven of the greenback? This week’s US data was hardly inspiring, but the real reason why the dollar couldn’t catch a bid is that its position on the “risk spectrum” has evolved over the last few months.
With the Fed embarking on what it suggests could be a prolonged rate hike cycle, long-term traders bought the greenback in anticipation of increasing carry in the future. In other words, the dollar had evolved, at least to some extent, into a trade where traders sought a return on their capital, rather than just the return of their capital. With sentiment souring at the start of the year, a portion of the traders have chosen to cash out of US dollar longs in favor of the ultra-low-yielding Japanese yen, which has surged more than 600 pips against the US dollar in the last month alone.
So what’s next for the greenback?
Despite this week’s lackluster performance, the dollar could still be a big beneficiary moving forward. If fears about China, oil, and a potential global slowdown continue to dominate, the dollar should eventually regain its safe haven status; after all, the US economy is still the proverbial “best house in a bad global neighborhood”, backed by the world’s most liquid markets and most powerful military.
Conversely, the dollar may also catch a bid if the current market swoon turns out to be an overreaction, as the Fed remains the most hawkish of the major central banks. While the median Fed member’s expectation of raising interest rates four times this year is looking increasingly fanciful, traders are now fully pricing in only a single rate hike this year, with an implied 27% chance of no rate hike at all in 2016, according to the CME’s FedWatch tool. That pessimistic assumption could shift dramatically in favor of dollar bulls if we see some optimistic signs out of China in the coming week (see the “Data Highlights” section below for more).
Technical view: Dollar Index
On a technical basis, the dollar index is trading between 98.00 and 99.00, essentially in the middle of its six-week range. Over the last couple of weeks, the weighted index has at least been able to put in a series of higher highs and higher lows, creating a near-term bullish channel in the process (see chart below). Meanwhile, the MACD is trending higher above both its signal line and the “0” level, showing bullish momentum, while the RSI indicator is holding above a multi-month bullish trend line of its own. Moving forward, a rally toward the 100.00 level on the dollar index will be favored as long as bullish channel support at 98.25 holds.
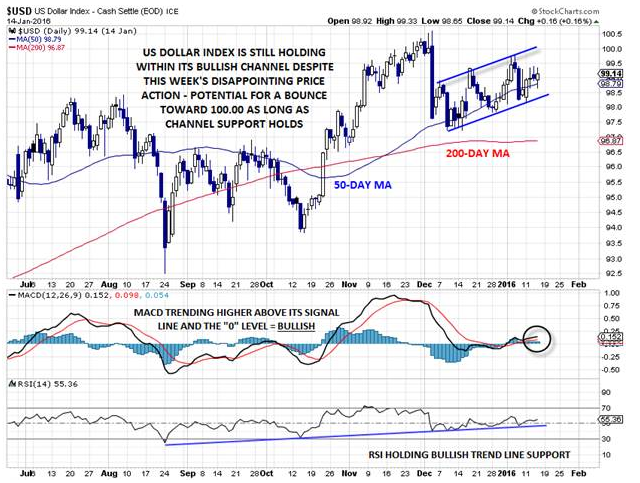
Source: Stockcharts.com, FOREX.com. Please note that the prices in the chart are only updated as of Thursday’s close.
Look ahead: Stocks
So far, 2016 is proving to be a very bad year for the stock markets, with relief rallies only lasting at best for a day or so. This just goes to show how weak the market is fast becoming. On Thursday there was finally some hope as the global stock indices surged higher from deeply oversold levels. The markets rallied as oil bounced again off the psychologically important $30 handle. But those hopes were dashed by the very next trading day as Chinese shares led a decline in global markets and crude oil fell below $30 a barrel. At the time of writing this report on Friday, US indices were deep in the red with the Dow Jones Industrial Average plunging by 400 points.
Evidently, oil is continuing to be the number one driver for stocks, which is why the UK-listed resources stocks were showing big falls on Friday. But will stocks be able to decouple themselves from the oil market? Or better still, will oil be able to form a base soon? While this is possible, especially with crude hovering around the $30 handle, the fact that it is struggling to make a comeback is not a good sign. This is yet another blow for the commodity currencies and energy stocks, as it just goes to show what speculators are feeling at the moment about the prospects of fresh supplies hitting an already-saturated market from Iran. Those who had hoped to see a more significant rebound from $30 will have been disappointed, and so the withdrawal of bids from this group of speculators is further clearing the path of least resistance which at the moment is clearly to the downside. Indeed, if crude holds below the $30 level on a closing basis, then there is not much further significant support until $25 now. That being said, however, short-covering later on in the day ahead of the weekend could see oil and stocks bounce back. If for whatever reason oil closes the day decisively back above $30, then that would be a bullish technical scenario. And not just for oil, of course.
As far as stocks are concerned, US earnings, which kick into a higher gear next week, may be one potential source of support for the struggling markets next week. Not that the analyst expectations are bullish – far from it – but the already-downbeat forecasts could easily be beaten. Among the major US companies reporting their results next week will be:
· Tuesday: 19 Jan
o Delta Air Lines (N:DAL)
o Morgan Stanley (N:MS)
o Charles Schwab (N:SCHW)
o Tiffany & Co (N:TIF)
o Bank of America (N:BAC)
o IBM (N:IBM)
· Tuesday 20 Jan
o Goldman Sachs Group Inc (N:GS)
· Wednesday 21 Jan
o Bank of New York Mellon Corp (N:BK)
o Southwest Airlines Company (N:LUV)
o Verizon Communications Inc (N:VZ)
o American Express Co (N:AXP)
o Starbucks Corp (O:SBUX)
· Thursday 22 Jan
o General Electric Co (N:GE)
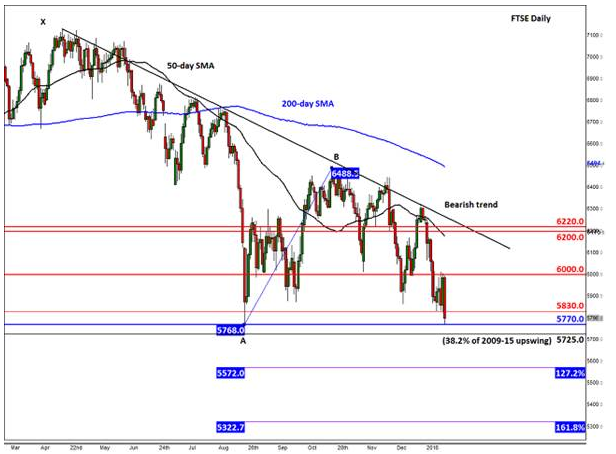
In Europe, the UK’s FTSE 100 will remain in focus due to the ongoing volatility in the oil and other commodity markets. At the time of this writing on Friday, the index was below a technical support level of 5830, where it had found repeated support in the past. Though it was still holding above the August 2015 low of 5765/70, chances are it will probably break below here too rather than find a double bottom reversal pattern. But rather than guessing the outcome, both the bulls and bears should wait and see what the index will do here before committing to a trade. A potential breakdown could pave the way for the Fibonacci extension levels at 5570/5 (127.2%) and 5320/5 (161.8%). The 38.2% Fibonacci retracement level of the entire 2009-2015 upswing comes in at 5725; this could be an important level to watch, should we get there. On the other hand, if the bulls manage to hold their own here then there is a chance for a recovery early next week. But as Thursday’s kick-back rally failed at the important 6000 level, speculators should watch this level closely going forward. Only a break above 6000 would be deemed a bullish outcome, as things stand. If seen, the FTSE may then rally all the way back to the bearish trend line and the next key resistance area between 6200 and 6220.
Look ahead: Commodities
Whether we like it or not, it appears as though crude oil is driving almost everything at the moment. It has been correlating positively with the equity markets, which makes sense because of oil’s obvious impact on the energy stocks. In FX, the likes of the CAD, NOK and RUB have all suffered big falls, which also make sense because of the fact Canada, Norway and Russia are among the oil exporting countries. The EUR meanwhile has found support in recent times because the on-going stock market sell-off (which has undoubtedly been made worse by the falling price of oil) means that traders are unwinding their carry trades. The volatility in oil prices is therefore currently having an indirect impact on the euro, too. So whatever you are trading, lose focus of oil prices at your peril!
Oil prices suffered a fresh blow this week after the US Department of Energy reported a very bearish-looking oil report. Contrary to data from industry group the American Petroleum Institute, the official report showed a build of 0.2 million barrels in inventories for the week ending January 8. Although admittedly this was a very small build, it was still way off the API’s estimate of a 3.9 million barrel drop. In addition, crude stocks at Cushing reached a record high while stocks of oil products also jumped, with gasoline inventories rising by 8.4 and distillates by 6.1 million barrels in the reporting week. The data therefore suggests that in addition to oversupply, demand may not be as strong as previously thought.
Outside of the US, the other big worry for oil speculators is Iran’s potential return to the market, which looks imminent now. Though this will almost certainly be another bearish development for oil prices as it will mean even higher global oil supply, we probably wouldn’t see a massive reaction when the deal is announced because most of the news has already been priced in. The full impact may be felt when the market knows for sure how much oil Iran will actually produce and what the response from its competitors will be. Will the OPEC accommodate for this additional supply by reducing existing output? We have serious doubts about that, especially given the increased tensions between Iran and Saudi Arabia recently. Iran may have to sell its oil cheaper in order to attract fresh customers, and this may start another price war within the OPEC. So, there are lots of unanswered questions and for that reason the near term outlook for oil remains bleak.
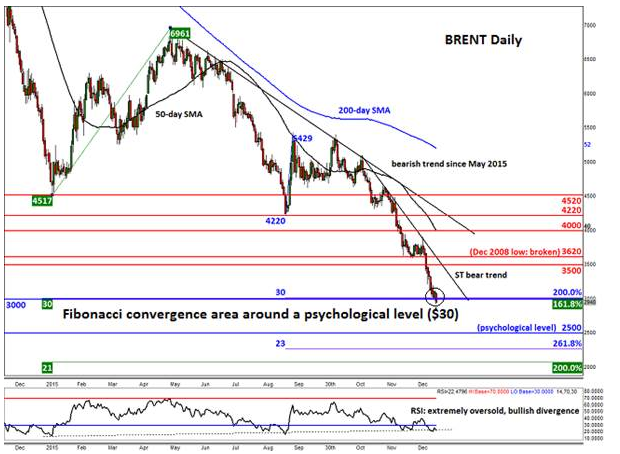
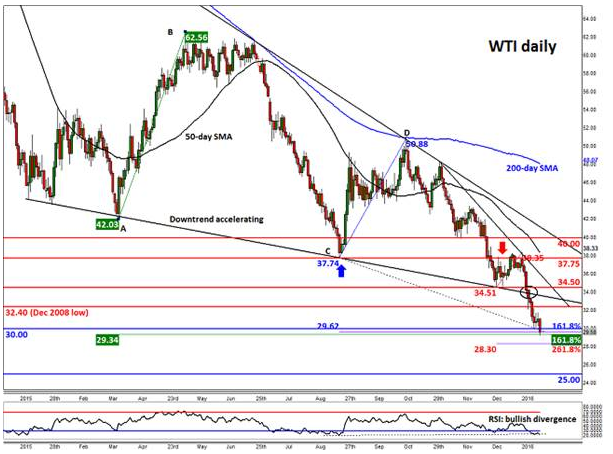
As another brutal week comes to an end, both oil contracts are below the $30 handle as we go to press. If Brent and WTI manage to stage an unexpected rally back above their respective psychological levels now in spite of all the bearish news out there, then this would be deemed a rather bullish outcome for the first part of next week. In addition to other technical factors, $30 on both contracts converge with the Fibonacci extensions of the previous price swings, which means the $29-30 range could be home to potential exhaustion points for oil. But if crude fails to bounce from these exhaustion points then this would strongly suggest that the selling pressure is heavy and that a breakdown towards the next psychological support at $25 could get under way soon.
Source: FOREX.com. Please note this product is not available to US clients.
Source: FOREX.com. Please note this product is not available to US clients.
Global Data Highlights
Monday, January 18
No major economic data releases scheduled – US on bank holiday in observance of Martin Luther King Day.
Tuesday, January 19
2:00 GMT – Chinese Q4 GDP and Industrial Production
With all the hullaballoo about China in the first two weeks of 2016, the Q4 GDP report from the world’s second-largest economy will certainly be widely watched by nervous traders. Economists expect to learn that the Chinese economy grew at a 6.9% annualized rate in Q4, a tick below the 7.0% goal set out by the Chinese government. Given the country’s current precarious position, some believe that policymakers will “massage” the GDP reading (along with the accompanying Industrial Production report) in order to ensure that it at least meets, if not outright beats, the market’s subdued expectations.
9:30 GMT – UK CPI
We’ve seen a dramatic shift in interest rate hike expectations for the BOE, driven heavily by geopolitical concerns, including an upcoming “Brexit” vote and falling oil prices which are expected to keep headline inflation subdued in the near term. Throughout Q2, Q3, and Q4 of 2015, the UK’s CPI figures held essentially flat near 0% and another reading in that region is likely this month. That said, a slightly hotter-than-expected print could lead to an oversold bounce in the battered pound.
10:00 GMT – Eurozone ZEW Economic Sentiment Report
Shhhh! I’m going to let you in on a secret: the Eurozone economy isn’t actually doing all that bad of late. The ZEW economic sentiment report, which is one of the best, most up-to-date economic indicators of consumer and business confidence, has actually improved in each of the last two months and is now solidly back in positive territory. Another decent reading here could play into the ECB’s meeting on Thursday (see below).
TBD – GDT Global Dairy Trade Index
This relatively obscure fundamental indicator is consistently one of the most important drivers for the New Zealand dollar. Dairy prices declined at the last auction two weeks ago, and another decline could be in the cards given the general weakness in commodities and fears about China’s economy.
Wednesday, January 20
9:30 GMT – UK Employment report
The UK economy has seen more new unemployment claimants for each of the last four months, and based on the recent Manufacturing PMI data, that sector likely laid off more workers in December. In addition to the headline jobs report, the November wages Index will be released at the same time. It has shown that wage growth has come in below expectations for five of the last six months, which is a big factor behind fading expectations of a BOE interest rate hike this year.
12:30 GMT – US CPI
The minutes from the most recent Federal Reserve meeting showed that several Fed officials would like to see actual signs of inflation before raising interest rates aggressively, and the CPI is the most widely-followed measure of inflation (though not necessarily the Fed’s preferred indicator). Regardless, inflation is expected to come in flat m/m, primarily due to the renewed drop in oil prices; if it prints as anticipated, the report could prompt traders to revise down their expectations of a March rate hike marginally, with potentially negative implications for the US dollar.
15:00 GMT – Bank of Canada Monetary Policy Decision
Speaking of oil, the big drop in “black gold” has been a massive thorn in the side of the Canadian economy. As a result, many traders are now expecting the BOC to cut interest rates this year, a big shift from the hikes expected a few months ago. That said, we don’t anticipate any fireworks at this week’s meeting, though the tone of the statement and BOC Governor Poloz’s statement could still have an impact on the Canadian dollar and equity markets.
Thursday, January 21
12:45 and 13:30 GMT – European Central Bank Monetary Policy Decision and Press Conference
While the Eurozone economy as a whole isn’t doing too badly, there are some pockets of weakness, especially when it comes to price pressures (inflation). Especially after the central bank failed to live up to dovish expectations at its December meeting, there’s a chance it could pave the road for more easing later this year in Thursday’s meeting. As always, traders are likely to be left “reading the tea leaves” of the statement and press conference in an effort to divine future action, so volatility in European assets seems the most likely outcome.
Friday, January 22
9:30 GMT – UK Retail Sales
A busy week for UK data winds down with the release of December’s retail sales figures, which are actually explicated to decline slightly month-over-month. That said, this release is fairly volatile on a month by month basis, so the subdued expectations are by no means a death knell for the UK economy or pound. In addition to the headline figure, traders should also watch for any revisions to previous readings; in three of the last four months, we’ve seen notable downward revisions to the previous retail sales report.
