Back in August, well-known market analyst Marc Faber was calling for an 1987-style crash and said the markets would drop 20% (click for video link). Also during that time, the financial media was all worked up by "Hindenburg Omens" popping up repeatedly during the month. A short description of the frightening market-event is provided below from Wikipedia. Named after the famous Zeppelin airship that exploded in a disastrous fire...
The Hindenburg Omen is a combination of technical factors that attempt to measure the health of the NYSE, and by extension, the stock market as a whole. The goal of the indicator is to signal increased probability of a stock market crash.
At the time, I wrote two articles showing how market internals were still bullish and did not support the pessimistic view:
- Addressing Marc Faber’s Call for an 1987-Style Crash (08/09/2013)
- Hindenburg Omen – Imminent Warning or Just Hot Air? (08/14/2013)
In both articles I tried to examine market data to see if there was a major market top forming, and digging into the details provided no context with which to call for a crash or bear market. For example, in my August 14th article I made the following observation:
So, while the new 52-week highs and lows were relatively close in number, their makeup was very different as new highs were dominated by larger cap operating-only companies while new lows were dominated by fixed-income closed-end funds and very small companies. Additionally, I do not believe the May cluster nor the present cluster of Hindenburg Omens will prove to characterize a market top as new 52-week highs continues to dominate new lows...completely unlike what we saw in 2007.
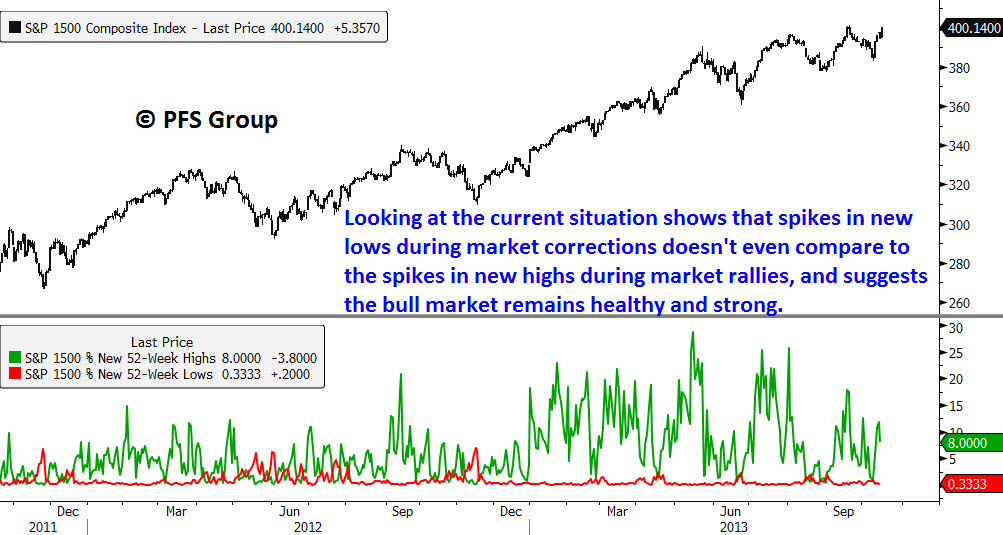
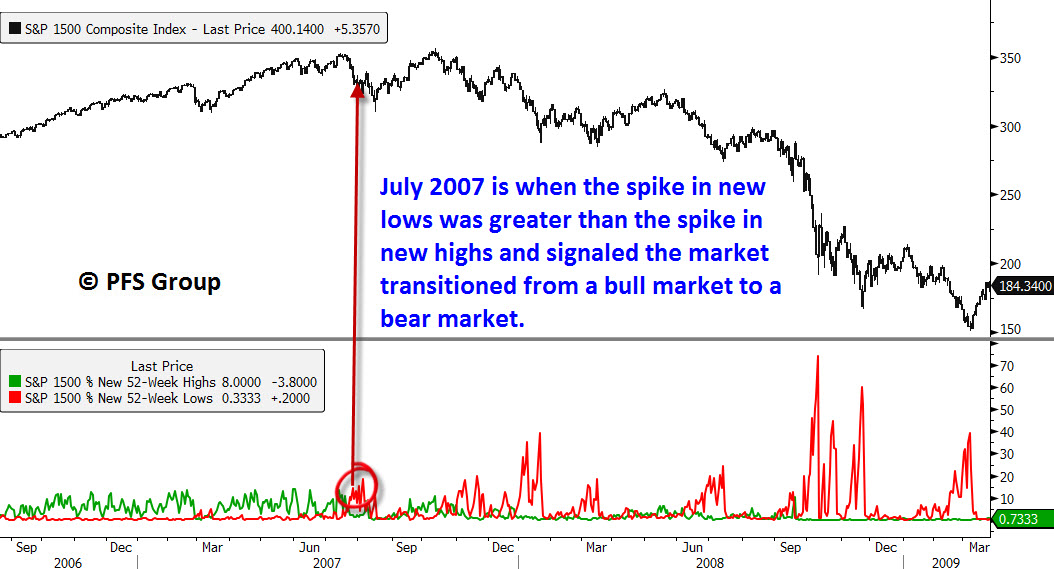
We are now two months past those calls for a crash and the small cap Russell 2000 Index stands at an all-time high as does the mid cap S&P 400 Index, with the large cap S&P 500 only 8 points away from hitting another all-time new high. When looking at the makeup of new 52-week highs and lows for the S&P 1500 (1500 total companies from small cap to mid-cap to large cap) we see that the bulls continue to hold the reins as spikes in 52-week highs during rallies trumps spikes in 52-week lows during declines. Compare the above picture to July of 2007 where the spike in new 52-week lows during the July correction exceed the spike in 52-week highs in the preceding rally. The larger spike in 52-week lows than the previous new high spike indicated the point of when the bears took control and the bear market began.
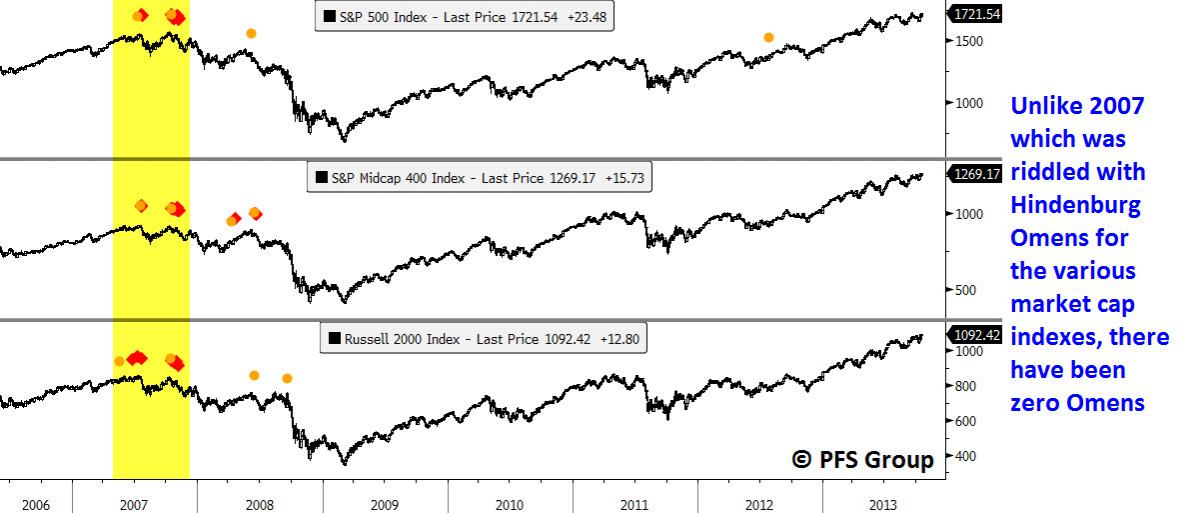
 Again, when looking at 2013, we see nothing like what we saw in 2007. Additionally, while the NYSE observed several Hindenburg Omens this year, pure operating-only company indexes with no fixed-income securities in them like the S&P 500 or Russell 2000 have not seen any such omens this year. In fact, only once since the bull market began has a Hindenburg Omen been seen between the S&P 500, S&P 400, and Russell 2000 indexes, which was one in 2012 on the S&P 500.
Summary:
When the media or so-called market gurus make scary predictions of crashes and bear markets, it is far better to dig beneath the surface to see if their claims have any validity. Digging beneath the surface to detect subtle changes in the market’s character is the purpose behind my weekly “Market’s Bill of Health” reports that come out on Friday, and currently I see no indication of a market top, let alone an approaching bear market.