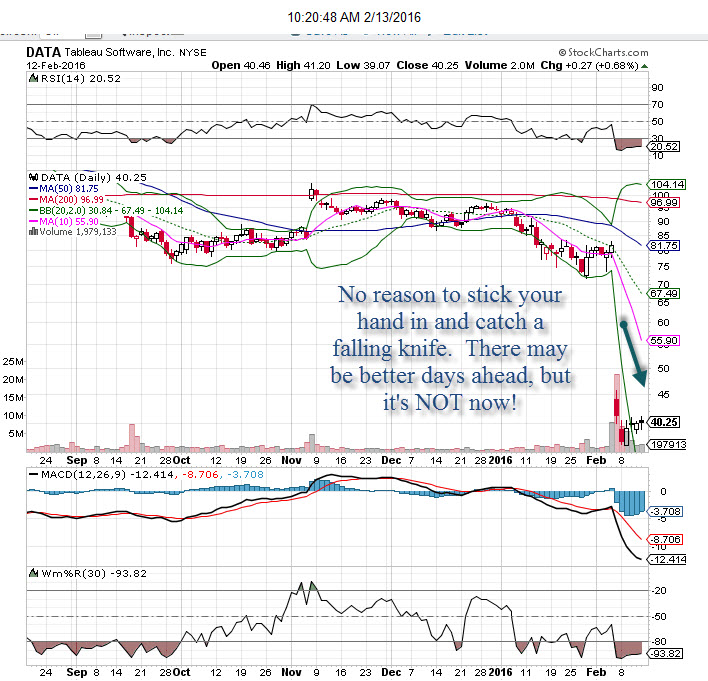
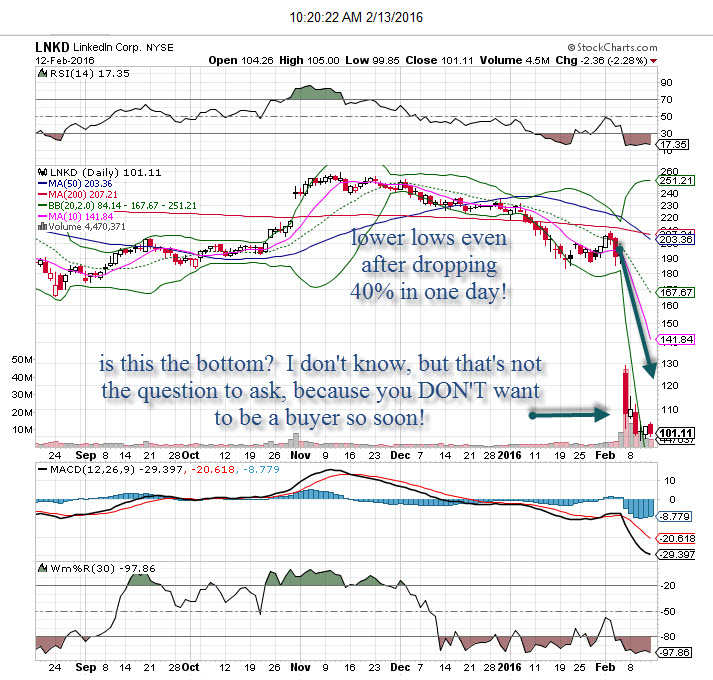
Recently we saw some epic declines of individual stocks after posting shaky earnings reports. Topping the list was long-time growth name LinkedIn (N:LNKD), the social networking giant who saw its market value nearly cut in half after reporting weak forward guidance. Tableau Software (N:DATA) had it even worse, falling nearly 50% on the same day. We also witnessed other stocks with smaller but still significant declines (Hanesbrands Inc (N:HBI) and Outerwall Inc (O:OUTR)).

This big money selling the stock indiscriminately. When we want to get long we look to follow the institutional flow, but when they are selling we need to exit and just get out of the way.
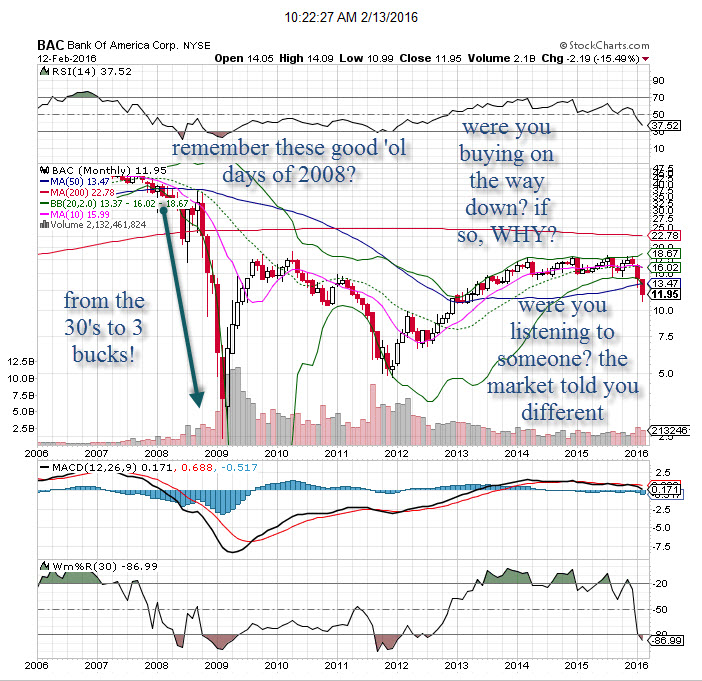
Now, some may look upon these drops as 'gifts from the trading gods', but frankly they are really no bargain. Oh, on a longer time line you may eventually be correct. For example, those who bought Bank of America (N:BAC) all the way from the 30's in mid 2008 to about $3 just six months later probably got out at even or just a smaller loss. The beating these financials took was unprecedented, yet each drop was supposedly the 'buy of a lifetime'. Nothing but hope and time wasted waiting. But if you waited long enough for the sellers to finish up you would not have found yourself in hope mode.

Back to the stocks previously mentioned. When there is an 'earthquake' in a stock we often experience aftershocks to follow. Institutions do not distribute stocks all in one shot, though it may seem like it. Selling happens for many days, and as we see from the chart these stocks are still being sold. Market rallies do not help stocks rise when there is heavy supply, in fact owners will use these rallies to sell more and least get a 'decent' price.

Volatility in 'blow up stocks rises then starts to retreat as the range starts to narrow, but the damage has already been done. All of these stocks have seen lower price lows AFTER the initial break. That is not a coincidence. While some of these stocks have recovered a bit (HBI is really the only one) from the initial shocking drop, all of them are FAR away from a good buy. You may have thought a 40% drop in LinkedIn to 110 was what you were waiting for, but now the stock is 101, and being down 10% if you bought it on the first break doesn't seem like a smart idea now.
Ideally, we would wait for the selling to subside, a nice base has been built (telling us the excess supply is being worked off) and the stock starts to move upward. The basing could take days weeks or months. The bigger the first drop, the longer the basing will be. In the case of LinkedIn and Tableau Software, we may not see these stocks recover for many months to come. Is it worth it to leave your money in a stock that just won't attract the interest of big money?