Loretta Mester, President of the Cleveland Federal Reserve, described the weaker-than-anticipated September employment report as “solid.” She went on to say that “the unemployment rate is about what my estimate of full employment is.”
Meanwhile, Fed Vice Chairman Stanley Fischer explained that the 156,000 jobs created was pretty close to a “Goldilocks” number. The 156,000 jobs created missed economist projections of 176,000; more importantly, it fell far short of a meaningful job growth number in the 200,000s.
Clearly, voting members on the Federal Open Market Committee (FOMC) are working hard to establish a case that rates should be raised from 0.25% to 0.50% in December. It is not that they are hawks who genuinely believe the economy is on solid footing. On the contrary. They began the year with an intention of raising rates four times in 2016. To save face in a slow-growing economy, the institution’s participants want to nudge the overnight lending rate up at least once in the calendar year.
Yet the idea that anyone in a position of rate manipulating power actually thinks that employment trends are “solid” or “Goldilocks-like” or “close to full employment” is silly. These individuals are intelligent. They know that the actual data demonstrate how Americans have yet to recover from the Great Recession, even after seven-and-a-half years.
For example, the headline unemployment U-3 rate of 5% is being used to make Americans feel good about the state of the jobs market. Yet U-3 does not come close to representing the true picture of employment. On the other hand, the U-6 rate endeavors to capture persons marginally attached to the labor force as well as those who are employed part time for economic reasons. These are the unemployed folks, the woefully under-employed and the discourage people who no longer look.
Before the recession, U-6 jockeyed around the 8% level. Today? It hangs out near the 10% level (9.7%), representing millions and millions who are routinely left out of the discussion.
There’s also Mester’s highly misguided statement that:
“75,000 to 120,000 jobs added is what is needed to keep unemployment stable.”
Wow, really? Then we better start redefining what unemployment really is. In particular, before the start of the financial crisis in 2007, roughly 16.75% of 25-54 year olds had been absent from the workforce. Today? 18.5%. The trend toward losing millions of prime-aged working adults is a shift in the wrong direction.
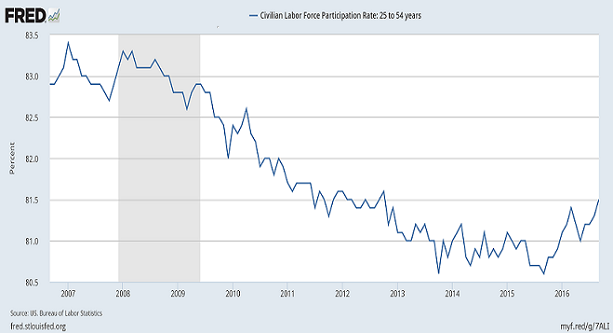
Granted, there appears to be improvement from the 81% participation rate that represents the longer-term 9-month moving average. Perhaps more 25-54 year olds are about to go back to work. However, we are going to need a whole lot of folks going back to work just to make up for the growth in the population.
What do I mean? Job gains of 150,000 just are not going to cut it. Even 200,000 may not capture the amount of jobs that the United States economy needs to create to account for new working-aged individuals in the overall population.
Consider job growth since the recession’s end. 13.5 million jobs. That sounds like an accomplishment. Unfortunately, if 18 million people arrive on the scene, that implies 4.5 million in negative growth for jobs.
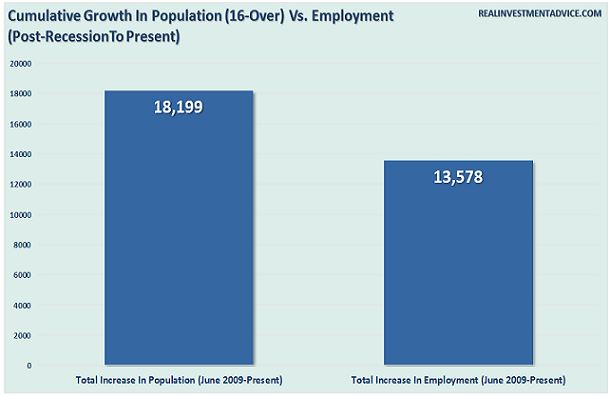
Think of it like a 3-lane highway. If more and more drivers move into town or become old enough to drive, and if very little is done to expand the road to 4 lanes or even 5 lanes, the results are pretty dire.
So millions and millions of Americans are routinely forgotten about, whether we talk about the U-6 unemployment rate failing to recover pre-recession levels, or whether we talk about job growth in relation to population growth, or whether we talk about substantive declines in the participation of a prime working-age demographic (25-54). Has there been progress in the current economic expansion? Are many getting back on their feet? Absolutely. Nevertheless, the uninspiring employment data described above have a great deal to do with why the Fed has barely moved rates off the zero-bound.
Good thing for investors in stocks, bonds in real estate, though… right? Had it not been for the Fed’s willingness to create electronic dollar credits to buy assets – had they not chosen to front-load an enormous rally to reflate asset prices – holders of those assets would not be feeling as wealthy as they do right now. The S&P 500 has catapulted higher with every quantitative easing (QE) initiative; the index has even managed very slight gains during periods when the Fed maintains its bloated balance sheet through reinvestment of maturing securities.
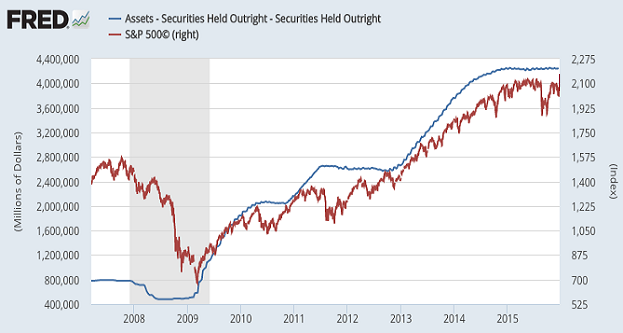
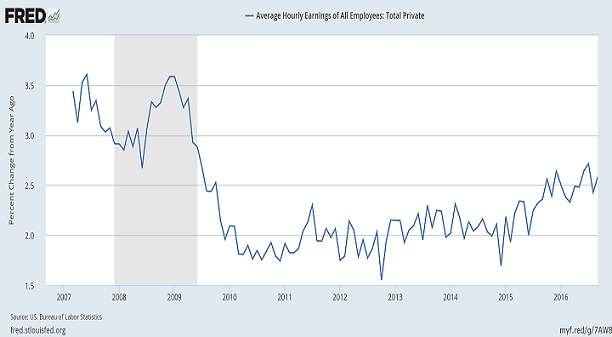
Still, will the Fed ever consider raising overnight lending rates beyond a face-saving quarter point annually in December? (They did so in 2015; they’ll likely do one more here in 2016). Are employee wages really growing at a blockbuster pace… enough for anyone to worry that the job market is actually overheating?
In yet another example of how the economy has still not recovered to pre-recession levels, the year-over-year change in wages show some improvement since 2010. On the flip side, wage growth simply hasn’t materialized in a manner that is robust.
Don’t get me wrong. I am by no means advocating that the Fed should stand pat. In fact, they should have normalized borrowing costs once the essence of the crisis had abated. In not doing so, monetary policy leaders have simply engineered a sub-standard economic expansion characterized by wealth inequality and asset valuation extremes.
The next two charts, courtesy of Eugen von Bohm-Bawerk, clarify the finer points of the Fed’s dilemma. A simple chart of household net worth as it relates to nominal economic growth (GDP) demonstrates how Americans have become addicted to low rate stimulus. First the Fed helped fuel the stock bubble in the late 1990s; later, by keeping rates too low for too long, and raising overnight lending rates at a snail-like pace, it ignited the housing balloon.
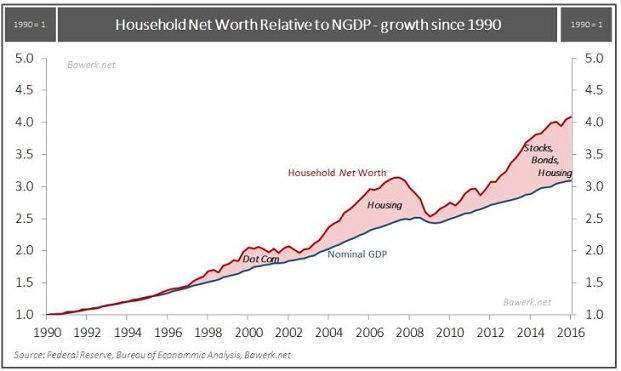
The take-away from household net worth to GDP is that bubbles and balloons typically burst. Sometimes the air comes out slowly, and other times it ruptures. In either case, one should expect household net worth to revert back toward the economic trend. An analysis of our current circumstances suggests that a pan-asset blister is very likely to ooze water as it reverts to the longer-term GDP trendline.
“But, Gary,” you protest. “How do you see this being the Fed’s fault for endlessly lowering rates since the early 80s? Wouldn’t a chart like this show excesses in every bull market?”
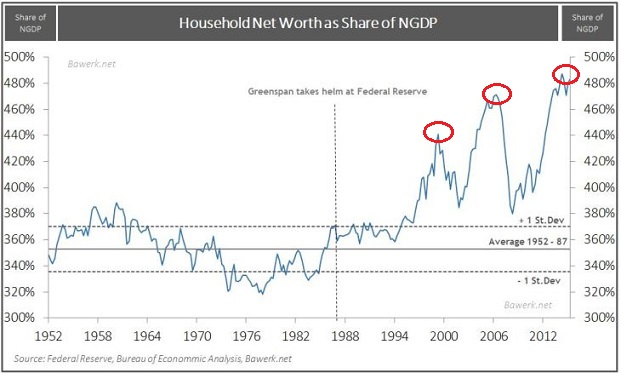
Actually, no. In the 35 years between 1952 and 1987, central bank planning did not solely concentrate on lowering rates to encourage a wealth effect. During the period, household net worth to GDP typically remained within a single standard deviation of its average (mean).
Then Alan Greenspan took the helm at the Federal Reserve. The “Maestro” should be credited with contributing mightily to the dot-com disaster as well as the housing collapse. As for where we stand today? Ben Bernanke and Janet Yellen should be credited with a probable bursting of the pan-asset blister.
Is it going to happen tomorrow? Next month? Next year? Nobody knows. Moreover, nobody knows what the extent of the asset deflation will be, or how it will play out – over 6 months, 12 months, 18 months, 24 months or three years.
Now, some investors may express dissatisfaction with not knowing the precise timing, duration or extent of the bearish price depreciation to come. Their answer is to hold-n-hope. Why not? You cannot predict the future.
I have a different approach. When the risk of financial loss is substantial, and when the reward prospects for that risk are strikingly modest, keep more cash on hand than you might otherwise have. Cash reduces volatility. Cash gives you alternatives. Cash that one holds for a relatively short period of time (0-3 years) does not lose to inflation when it is highly likely to buy desirable assets at extraordinary discounts. In so doing, that cash actually helped you beat any erosion of purchasing power.
Disclosure: Gary Gordon, MS, CFP is the president of Pacific Park Financial, Inc., a Registered Investment Adviser with the SEC. Gary Gordon, Pacific Park Financial, Inc, and/or its clients June hold positions in the ETFs, mutual funds, and/or any investment asset mentioned above. The commentary does not constitute individualized investment advice. The opinions offered herein are not personalized recommendations to buy, sell or hold securities. At times, issuers of exchange-traded products compensate Pacific Park Financial, Inc. or its subsidiaries for advertising at the ETF Expert web site. ETF Expert content is created independently of any advertising relationships.
