On Tuesday, the Bureau of Labor Statistics announced that the US Consumer Price Index (CPI) rose at a seasonally adjusted annual rate of 3.13 percent in June. What does such a figure really mean? Is it a measure of inflation or of the change in the cost of living? Until recently, I would have answered that there was no difference, but a recent series of posts by Mike Bryan on the Atlanta Fed’s Macroblog has made me think again.
What’s the difference?
As Bryan explains it, the cost-of-living concept arises from the role of money as a medium of exchange. When we say the cost of living increases, we mean that it gets harder to maintain a given standard of living on a given income. Either we have to be satisfied with fewer goods or services, or save less, or work harder. In the language of economics, a change in the cost of living is a real phenomenon.
On the other hand, we can best understand inflation as a change in the value of our unit of account, the dollar. When there is inflation, the value of the unit is smaller each day than it was the day before, for all transactions. This earlier post includes a chart showing how dramatically the value of our unit of account has changed over the past 100 years.
Imagine that you woke up one morning to find that someone had chopped an inch off all our rulers, so that today’s foot was now only as long as yesterday’s eleven inches. You might go from being six feet tall to six-foot-six, but it wouldn’t be any easier for you to reach the top shelf in the kitchen without a footstool. Similarly, if inflation raises both your income and the prices of everything you buy by the same percentage, the value of a dollar as an economic ruler shrinks, but it is neither harder nor easier to maintain the same real standard of living. In that sense, inflation is a purely nominal phenomenon.
There are two other important differences between inflation and changes in the cost of living.
First, although they are both harmful, they are harmful in different ways. An increase in the cost of living hurts people because it makes them poorer. The harm from inflation is more subtle. Inflation makes it harder to plan for the future, so it discourages investment. It erodes the real value of cash and other assets that have fixed nominal values, so it discourages saving. Because the rate of inflation typically becomes more variable as it becomes more rapid, it increases uncertainty. People can overcome some of the uncertainty by indexing the contracts they make, but indexing is costly and never perfect. When we take all these effects together, inflation makes markets work less efficiently and slows economic growth.
Second, the effects of inflation are the same for everyone, but changes in the cost of living vary from place to place and from person to person. If inflation shrinks the unit of account by 3 percent, then the real values of anything with a fixed nominal value—a paycheck, of a Treasury bond, or of a contract to deliver goods—all fall by 3 percent. In contrast, a change in the a broad index like the CPI affects people’s cost of living differently according to which components change. An increase in the price of heating fuel affects people in cold regions more than those in warm regions. An increase in the price of meat does no harm to vegetarians. The cost of living in New York does not necessarily keep pace with that in Oklahoma City. The Bureau of Labor Statistics acknowledges this to some extent by publishing separate indexes for different groups (all urban residents vs. wage earners and clerical workers) and for different regions, but those still only approximate differences in the cost of living.
Can we measure inflation and the cost of living separately?
The consumer price index is primarily a measure of the cost of living. Each month, the BLS gathers data on the prices of hundreds of goods and services. After making adjustments for changes in package sizes, and, periodically, for changes in quality, it reports the result as a weighted average. If your consumption patterns are reasonably close to the average, the change in the CPI tells you how much harder or easier it is to maintain your standard of living on a given nominal income.
At the same time, the monthly change in the CPI also tells us something about inflation. Over time, as the CPI goes up, the value of the dollar as a unit of account goes down. The challenge is how to extract the faint signal of inflation from the noise produced by transient monthly ups and downs in the price of individual goods.
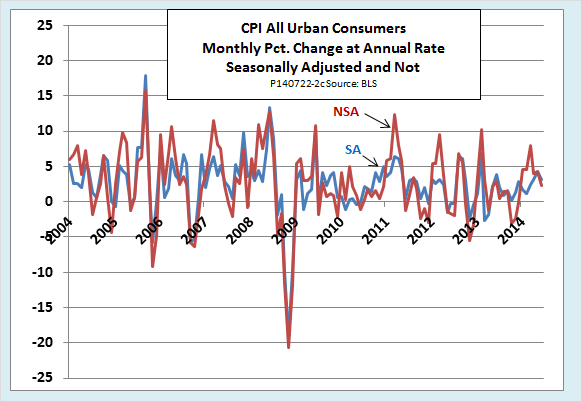
The first step in extracting the inflation signal from cost-of-living data is to adjust for predictable seasonal changes in the cost of particular goods. For example, everyone knows that the price of fresh vegetables goes up when the summer harvest season is over, but if we expect the price to go down by the same amount next summer, we don’t count the seasonal change as inflation. Consequently, the BLS reports the monthly CPI in both a seasonally adjusted version (SA) and a version without seasonal adjustment (NSA). As the following chart shows, adjusting the raw CPI for predictable seasonal changes greatly smoothes month-to-month volatility.
After making seasonal adjustments, the next step in extracting the inflation signal from the CPI is to sort out price changes that have particular, microeconomic causes from those that have more general, macroeconomic causes. Microeconomic causes include things like extreme weather events, wars, or developments in global commodity markets. Macroeconomic causes include changes in monetary policy, changes in fiscal policy, and the state of the business cycle.
For example, in June 2014, microeconomic causes, including conflict in Ukraine and Iraq, pushed the price of gasoline up 3.3 percent. Gasoline alone accounted for two-thirds of the monthly increase in the seasonally adjusted CPI, but it didn’t raise anyone’s income, unless maybe they happened to own a refinery. It just made most people feel poorer—a pure increase in the cost of living.
If we exclude food and energy prices from the CPI, which are especially sensitive to transient microeconomic influences, we get the so-called core CPI, which more accurately reflects the macroeconomic causes of inflation. That adjustment is a crude one, however, since food and energy prices are not necessarily the best or the only prices that we should exclude.
As Bryan points out in Part 2 of his series, there are more scientific approaches to deciding which items to exclude. One of them, which Bryan himself developed when working at the Cleveland Fed with Stephan Cecchetti, is called the 16-percent trimmed mean CPI. It excludes the 8 percent of prices that increase most in a given month along with the 8 percent that increase least, or decrease most. That series turns out to have three desirable statistical properties:
- It is 95 percent less volatile on a month-to-month basis than the all-items CPI and 25 percent less volatile than the core CPI.
- It removes most of the seasonal component from monthly variations in the CPI without the need to use explicit seasonal adjustment factors.
- It follows the same trend over time as the all-items CPI. In contrast, during periods when there are multi-year trends in global food and energy prices, the trend of the core and all-items CPI can differ substantially.
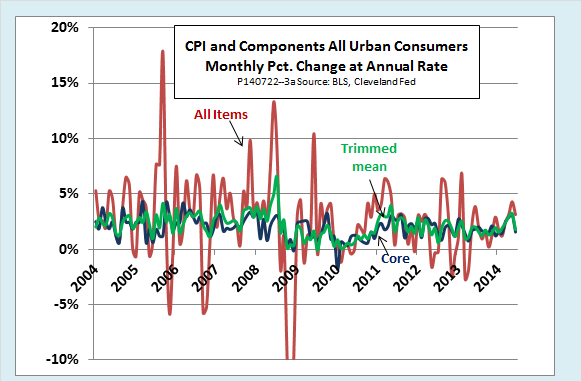
The following chart, which shows the 16-percent trimmed mean, all-items, and core CPI together, illustrates these properties. Of the three indexes, the trimmed-mean CPI comes closest to capturing the inflation component of price-level trends, whereas the all-items CPI best reflects monthly changes in the cost of living.
For devoted inflation wonks, there are still other ways to sift the inflation signal from the cost-of-living noise. The Atlanta Fed publishes a series that it calls the sticky price CPI. Unlike the trimmed-mean CPI, which excludes prices that change a lot in a given month, the sticky price CPI focuses on the 70 percent of goods and services whose prices change rarely. Reputedly, this series is not only less volatile than the all-items CPI, but provides a better forward look at inflation to come. Bryan also describes an experimental measure of inflation that throws out the expenditure weights used in the standard CPI, which reflect actual consumption patterns. Instead, it uses first principle components, a statistical technique that lets the data themselves determine the weights that best identify the inflation signal.
The bottom line
The bottom line here is that consumers and economists find different patterns in the blizzard of price data that confronts them each month.
Consumers look for changes in the cost of living. Among official data series, the consumer price index is probably their best guide. We can even argue that the non-adjusted CPI is a better indicator in that regard than the more widely publicized seasonally adjusted version. What is more, as I explained in this earlier post, the psychological filters consumers use to process the prices they encounter in everyday life tend to give an upward bias to their subjective estimates of cost-of-living increases.
Economists, instead, look for tends that are relevant to policy. If strife in an oil-producing state sends the price of gasoline higher, so what? There is little the Fed can do about it, so best to calm the waters by holding interest rates steady. On the other hand, an upward creep of even a few basis points per month in a trimmed-mean or sticky price index may show that the time has come to begin a gradual tightening of policy.
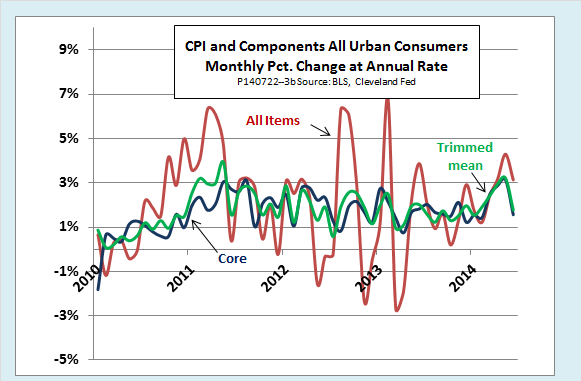
Right now, though, there is not much to get either consumers or policymakers excited. Even if we zoom in on the most recent period, as the next chart does, it is hard to spot much of a trend in either the filtered or unfiltered data.
True, oil markets seem to be a bit nervous. Vacationers who are disappointed to find that gasoline prices are going up may have to head for a closer national park or stay in a cheaper motel. Officials at the Fed, however, will probably find more of interest in real data on jobs and GDP than they will in recent inflation indicators, no matter how skillfully they massage them.


