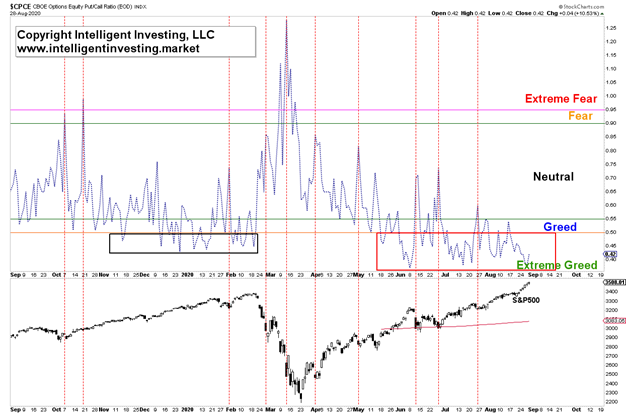
Back in May, see here, I first reported on the equities only put/call ratio (EO-P/C) and found that there was still upside potential but also downside risk involved. Four weeks later and the market had erased all its gains since that article. Since then, the rally has gathered steam and the EO-PC has been almost consistently below 0.5, and frequently below 0.4. See Figure 1 below. This low ratio means for each put that was purchased two, or even more, calls were bought. Thus traders and investors have been very Bullish on the markets, and now should be a good time to re-assess.
Usually, very low or high ratios can be contrarian signals as it means the market is becoming lopsided: too many people are betting on the same trend to continue. And the market tends to punish the majority. A high ratio is a much more reliable contrarian indicator for an important bottom than a low ratio: see the vertical dotted red lines.
Figure 1, daily CPCE ratio

The black box shows how for about three months -November 2019 through February 2020- the CPCE stayed mostly below 0.5, while the S&P 500 continued to march higher, with only a few pullbacks along the way. Fast forward to today and the recent rally, and we can see the CPCE is even lower compared to then (red box). It has been in extreme greed for most of the time, but the market has essentially rallied unabated, except for June.
So, will this mean the market will crash come September? It is a valid question to ask, as we are about to enter the only calendar month (September) where the S&P 500 has not risen more often than it has fallen over the past seven decades.
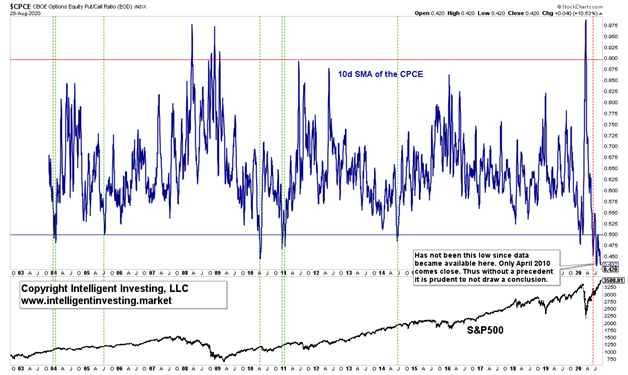
A good way to try to answer this question is by using a moving average of the CPCE. It smooths out the daily noise of the CPCE, and it allows us to look at its long-term track record as well because historical data can help provide a better context while always keeping in mind that “past performance is no guarantee for future results.” In Figure 2, I show the 10-day exponential moving average (10d EMA).
Figure 2. 10d EMA of the CPCE

Unfortunately, there is only data available since 2003, which means only one Bear market and two Bull markets are covered. Not a whole lot to go by, but it is what it is, and what I find is that the 10d EMA of the CPCE has never been this low. Now, without any historical precedent, it is tough to draw a valid conclusion. In science, no result is also a result, but let me relax the parameters a bit and look at all occurrences when the 10d EMA bottomed below 0.5. There were seven previous events since 2003: dotted green vertical lines. The only one to come somewhat close to today’s consistently low readings is August 2010. The S&P500 was back then about to enter a ~20% correction. Will that happen now too? Well, if I had done the same for when the 10d EMA bottomed back in 2010 it bottomed this low and the S&P500 lost 20% of its value, so expect the same now”. But that statement would have been proven wrong as the S&P500 only experienced an around 8% pullback before marching higher to new all-time highs.
Bottom line:
The current Put/Call ratios are historically low. So low, there’s no real valid comparison. Thus it is impossible to infer with certainty what the market will do next. Rally unabated, or correct heavily? Now, one can wonder, “why then publish a non-result that does not tell me much?”. Good question. As said, even non-results are results as it tells us to A) not rely on only one indicator to try to forecast the market’s next directional move, but to use all tools available: market breadth, technical analyses, Elliott Wave Principle, etc. B) realize that sometimes we have no answers, and new extremes can always be made in any indicator. However, just like in May, it seems a correction is more likely than not.
