As my colleague Fawad Razaqzada noted earlier today, oil prices are extending their recent collapse heading into today’s US session. The primary factors driving oil lower are the same ones your Economics 101 teacher droned on about during the first week of class: high supply (from Saudi Arabia increasing production) and low demand (from slowing economic growth in the Eurozone and China). In our view, the path of least resistance remains to the downside for oil.
…But What Do Collapsing Oil Prices Mean for FX?
Beyond the pure commodity trading realm though, the dramatic drop in the price of oil has big implications for forex traders as well. The currencies of countries that rely on oil exports (prominently Canada, Norway, and Russia) are being sold particularly aggressively. We already covered USD/RUB in yesterday’s EM Rundown report, but both USD/CAD and USD/NOK deserve a closer look.
USD/CAD: Could 1.15 or 1.16 Be in Play This Week?
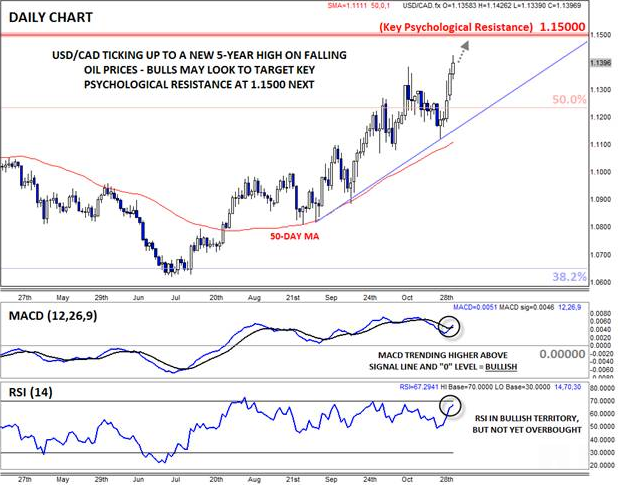
After initially consolidating below 1.1300 yesterday, USD/CAD has been in full rally mode for the past 24 hours. From a fundamental perspective, the pair’s oil exports are being hit from two directions, with the falling global price of oil and the the increase in US energy production decreasing the volume of Canadian oil exports.
As we go to press, rates have just broken out to a new 5-year high above 1.14, and frankly the unit looks like it may have further to run in the short term. The MACD indicator has turned back positive after consolidating the last two weeks, and the RSI indicator remains firmly in bullish territory, though not yet overbought. From here, rates may continue to rally toward key psychological resistance at 1.1500, and if oil prices continue their freefall, an eventual move toward previous resistance in the mid-1.16s is possible by the end of the year.

Source: FOREX.com
USD/NOK: Testing Resistance At 6.8630, but Breakout Could Target 7.30 Next
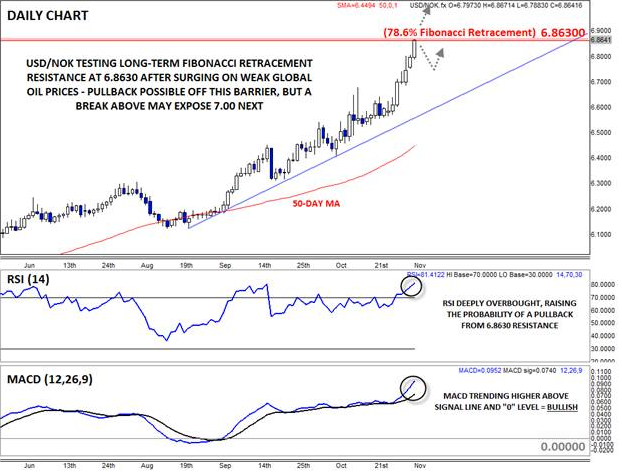
The rally in USD/NOK has been even more impressive. The pair has been consistently hitting new highs for weeks, helped along by a large monetary policy divergence and the aforementioned drop in oil prices. Now, rates are testing the 78.6% Fibonacci retracement of the 2009-2011 drop at 6.8630.
Having run much further in the past few weeks, USD/NOK may be more vulnerable to a near term pullback this week, especially with the RSI indicator deeply overbought. That said, a move above the 6.8630 level could pave the way for a continuation toward psychological resistance at 7.00 or even the 11-year high near 7.30 in time.

Source: FOREX.com
For more intraday analysis and market updates, follow us on twitter (@MWellerFX and @FOREXcom).
