This week’s calendar is loaded with important data. Now that the Jackson Hole Fed Conference is over, can we expect a policy change soon? Every data report this week will get special scrutiny. Will the Fed get the signal to hike rates?
Last Week
The important economic news was pretty good, but interest focused on Chair Yellen.
Theme Recap
In my last WTWA, I predicted a weeklong focus on the Fed conclave at Jackson Hole and the implications of Chair Yellen’s speech. This was the story from CNBC’s opening on Monday through the Fast Money group on Thursday after the close. There was an interlude for the “squatty potty” story, but even CNBC cannot talk about the Fed all of the time. Jane Wells is a good sport about such assignments and seems to enjoy “suiting up” for the occasion. I congratulate her on her new status as “special correspondent.”
The Story in One Chart Short
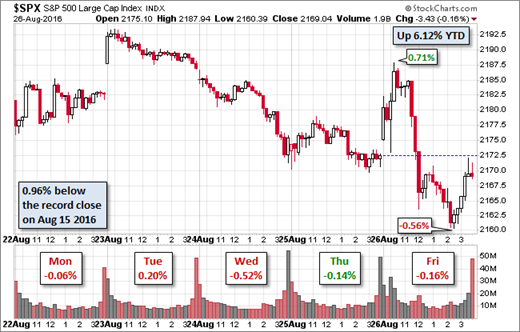
I always start my personal review of the week by looking at this great chart from Doug Short. The overall range is very narrow, with stocks remaining near record highs. It shows the effect from the Yellen speech, the Fischer comments, and the final verdict. It was all pretty muted. Doug has a special knack for pulling together all of the relevant information. His charts save more than a thousand words! Read his entire post where he adds analysis and several other charts providing long-term perspective.
The News
Each week I break down events into good and bad. Often there is an “ugly” and on rare occasion something really good. My working definition of “good” has two components. The news must be market friendly and better than expectations. I avoid using my personal preferences in evaluating news – and you should, too!
The Good
- Initial jobless claims fell 1000 to 261K. The four-week moving average also edged lower. This is a continuing strong signal about labor market conditions.
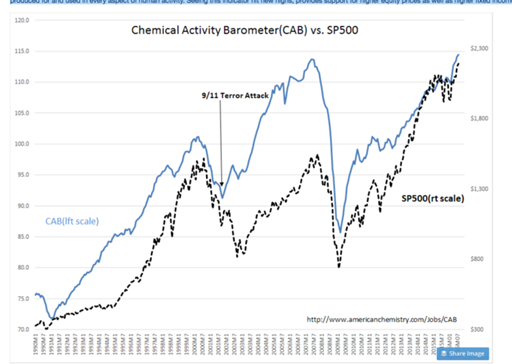
- Chemical activity continues higher. GEI has the story. “Davidson” (via Todd Sullivan) shows why this is important.
- Durable goods orders rose 4.4% snapping the recent losing streak.
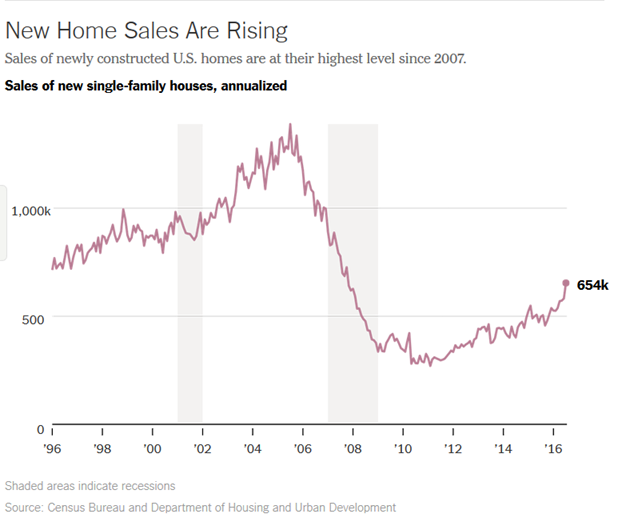
- New home sales beat expectations by a mile – SAAR of 654K versus expectations of 580. The NYT (finally) joins Calculated Risk in noting the rebound in the housing market.
The Bad
- Q2 GDP rose only 1.1% according to the revised calculations.
- Existing home sales declined 3.2%. Calculated Risk has the story.
The Ugly
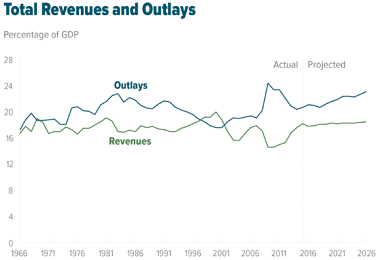
Budget projections. Left unchanged, the U.S. federal budget will increase in relation to total economic output for the first time since 2009. Econintersect.com does a great job of highlighting key reports from a wide variety of sources. This analysis from the non-partisan Congressional Budget Office includes a revealing chart of what is in prospect.
Perhaps one of the Presidential candidates will reach agreement with Congress to address this.
On a personal note, I used to teach a public finance course with a unit on budgeting. One of my favorite lectures included the progression of projections. What started out as “balanced” on a five-year projection always turned into a deficit when “year zero” was reached. I taught those classes a long time ago, but nothing has changed.
The Silver Bullet
I occasionally give the Silver Bullet award to someone who takes up an unpopular or thankless cause, doing the real work to demonstrate the facts. No award this week. Nominations always welcome! For ideas, go to your favorite conspiracy site and look for people doing data mining and/or poets writing about economics.
The Week Ahead
We would all like to know the direction of the market in advance. Good luck with that! Second best is planning what to look for and how to react. That is the purpose of considering possible themes for the week ahead. You can make your own predictions in the comments.
The Calendar
We have a huge week for economic data. While personally I watch everything on the calendar, you do not need to! I highlight only the most important items in WTWA. Focus is essential.
The “A” List
- Employment situation (F). Another strong report? Will this tip Fed policy into a rate increase?
- ISM index (Th). Great concurrent read on the overall economy with some leading aspects.
- Personal income and spending (M). You have to earn it before you can spend it! July data, but both are important.
- Consumer confidence (T). The Conference Board version helps to assess both job creation and spending plans.
- Auto sales (Th). One of the best non-government reads on the economy.
- Core PCE prices (M). This – not CPI – is the measure the Fed uses to evaluate the 2% inflation target.
- Initial claims (Th). The best concurrent indicator for employment trends, but less attention during “employment week.”
The “B” List
- ADP employment change (W). A good independent indicator of private employment growth. Deserves more respect.
- Pending home sales (W). Everything about the housing market is important, but pending sales are a bit less significant than other measures.
- Chicago PMI (W). The most important of the regional measures.
- Construction spending (Th). Volatile July data is important for the long-term trend.
- Trade balance (F). July data, widely misunderstood, but important for Q2 GDP.
- Crude inventories (W). Often has a significant impact on oil markets, a focal point for traders of everything.
The big news is the employment situation reports, especially coming right before Labor Day.
Next Week’s Theme
This week brought us another week of quiet trading, but the Fed conference may have teed up a policy shift. While the speeches were short on the specifics craved by traders and the punditry, the basic message was a bit more hawkish. The Fed expects an improving economy and tighter labor markets. This week’s data – and especially the employment report – will get special attention. Everyone will be asking: Will the Fed get the signal for a rate hike?
After Jackson Hole, there are three basic positions:
- Negative rates. While discussed, both Yellen and Fischer made it clear that this was not a serious option – at least not right now.
- Steady as she goes. Look for more economic strength before raising rates. Then move cautiously and slowly.
- Adopt a higher inflation target. Some believe that the long end of the curve will increase only when inflation expectations move higher. This means that the Fed must commit to stimulative policy even if inflation moves above the current 2% target. (Mark Thoma has an excellent description).
Regardless of the chosen position, there was general agreement that monetary policy was being asked to do too much. The neutral sounding calls for help with fiscal policy really means a call for Keynesian stimulus.
Opinion was clearly divided in the Jackson Hole showdown as well as the ensuing discussion. Feel free to add your own thoughts in the comments, including anything I have missed.
As always, I’ll have a few ideas of my own in the conclusion.
Quant Corner
We follow some regular great sources and also the best insights from each week.
Risk Analysis
Whether you are a trader or an investor, you need to understand risk. Risk first, rewards second. I monitor many quantitative reports and highlight the best methods in this weekly update.
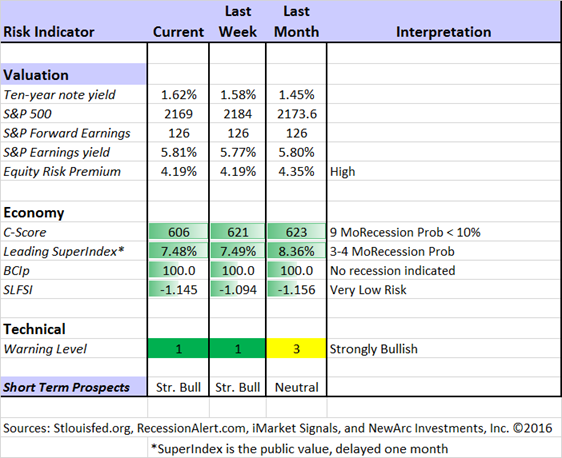
The Indicator Snapshot
The Featured Sources:
Brian Gilmartin: Analysis of expected earnings for the overall market as well as coverage of many individual companies. This week he expresses more confidence about growth in earnings.
Bob Dieli: The “C Score” which is a weekly estimate of his Enhanced Aggregate Spread (the most accurate real-time recession forecasting method over the last few decades). His subscribers get Monthly reports including both an economic overview of the economy and employment.
The recession odds (in nine months) have nudged closer to 10%.
Holmes: Our cautious and clever watchdog, who sniffs out opportunity like a great detective, but emphasizes guarding assets.
Georg Vrba: The Business Cycle Indicator, and much more. Check out his site for an array of interesting methods. Georg regularly analyzes Bob Dieli’s enhanced aggregate spread, considering when it might first give a recession signal. Georg thinks it is still a year away. It is interesting to watch this approach along with our weekly monitoring of the C-Score.
RecessionAlert: Many strong quantitative indicators for both economic and market analysis. While we feature his recession analysis, Dwaine also has a number of interesting approaches to asset allocation.
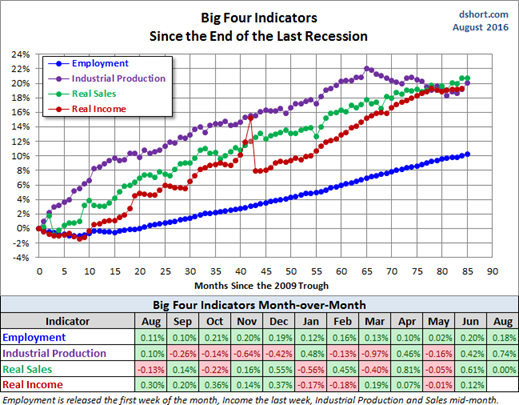
Doug Short: The Big Four Update, the World Markets Weekend Update (and much more).
The ECRI has been dropped from our weekly update. It was not so much because of the bad call in 2011, but the stubborn adherence to this position despite plenty of evidence to the contrary. Those interested can still follow them via Doug Short and Jill Mislinski. The ECRI commentary remains relentlessly bearish despite the upturn in their own index. Here is Doug’s latest update (including the recent retail sales data) of the Big Four indicators followed by the non-partisan, non-governmental NBER in dating recessions.
How to Use WTWA
In this series I share my preparation for the coming week. I write each post as if I were speaking directly to one of my clients. For most readers, they can just “listen in.” If you are unhappy with your current investment approach, we will be happy to talk with you. I start with a specific assessment of your personal situation. There is no rush. Each client is different, so I have six different programs ranging from very conservative bond ladders to very aggressive trading programs. A key question:
Are you preserving wealth, or like most of us, do you need to create more wealth?
My objective is to help all readers, so I provide a number of free resources. Just write to info at newarc dot com. We will send whatever you request. We never share your email address with others, and send only what you seek. (Like you, we hate spam!) Free reports include the following:
- Understanding Risk – what we all should know.
- Income investing – better yield than the standard dividend portfolio, and also less risk.
- Holmes – the top artificial intelligence techniques in action.
- Why 2016 could be the Year for Value Stocks – finding cheap stocks based on long-term earnings.
You can also check out my website for Tips for Individual Investors, and a discussion of the biggest market fears. (I welcome questions or suggestions for new topics.)
Best Advice for the Week Ahead
The right move often depends on your time horizon. Are you a trader or an investor?
Insight for Traders
We consider both our models and also the best advice from sources we follow.
Felix and Holmes
We continue with a strongly bullish market forecast. Felix is fully invested, including several aggressive sectors. The more cautious Holmes also remains fully invested.
Top Trading Advice
What are the distinguishing characteristics of top traders? Brett Steenbarger identifies five. How many describe you? My favorite is this one:
* Successful traders know when to not trade – They wait for opportunities; they pull back their risk taking when they’re not perceiving opportunity. It’s not that successful traders are always successful. It’s that their success springs from knowing how to not lose when they’re not seeing the ball well.
Insight for Investors
Investors have a longer time horizon. The best moves frequently involve taking advantage of trading volatility!
Best of the Week
If I had to pick a single most important source for investors to read this week it would be Bill Kort’s Apocalypse Now. He notes the media penchant for finding disaster lurking behind every corner. This may well be the single most costly mistake for investors. He does a nice job of linking it to this week’s issue:
Sure, there are apocalyptic events in the stock market, but the media makes them sound almost routine even though they are few and far between. Market attention via the media has been wrapped around another Fed fund rate increase as a catalyst for such an event. It is very doubtful that a quarter-point increase in the rate would be a disaster. In fact, worry over a Fed rate increase at this point is “much ado about nothing”.
Stock Ideas
Chuck Carnevale continues his helpful sector-by-sector review of dividend growth stocks. His articles are always a great source of ideas. I review them all, and you should, too.
Barron’s identifies the “ten best dividend stocks” noting valuation as well as yield. I like the list, because most of the names are those we often hold in our enhanced yield program. (We write near-term calls to get even greater yield from strong stocks). These are all interesting choices.
Holmes will begin contributing an idea each week, a stock we bought for clients a few days ago. I will mention it here and Holmes will also post it each Friday at Scutify.com. While we cannot verify the suitability of specific stocks for everyone who is a reader, the ideas may be a starting point for your own research. Holmes may exit a position at any time, and I am not going to do a special post on each occasion. If you want this information, just sign up via holmes at newarc dot com and you will get email updates about exits. This week’s Holmes pick is Level 3 Communications (LVLT).
Personal Finance
Professional investors and traders have been making Abnormal Returns a daily stop for over ten years. The average investor should make time (even if not able to read AR every day as I do) for a weekly trip on Wednesday. Tadas always has first-rate links for investors in his weekly special edition. There are several great choices worth reading, but my favorite is this advice from Morningstar’s Christine Benz, Retirement-Planning Assumptions: Yes, You Can Be Too Conservative: The risks of oversaving and underspending are real, too.
However, I think there’s a risk–albeit an under discussed one–that well-meaning retirees and retirement-savers can take caution too far. For example, I’ve run into 75-year-old retirees who, in the interest of playing it safe, are spending just 2% of their portfolios annually; at that pace, they’re very likely to leave a very large kitty behind. That may be what they want, but it may not be. In a similar vein, I’ve met 40-year-old accumulators who tell me that they’re certain Social Security won’t be there for them, or that they’re assuming their portfolios will return just 2% in their 25-year runway to retirement.
I see this so frequently. Many retirees are in a solid position to enjoy life, and they should do so!
Bond Funds and Bond Ladders
If interest rates rise, there is plenty of risk in both bond funds and stocks (utilities and classic dividend stocks) that are bond proxies. A bond ladder provides more control. Larry Swedroe, director of research for The BAM Alliance, explains the many advantages. I especially like the discussion of avoiding the impact of hot fund flows.
There’s another little-discussed benefit of owning individual securities. With a mutual fund (or ETF), after a period of falling interest rates, “hot money” chasing recent performance will typically buy into the fund. The fund, therefore, must buy more bonds in a low-rate environment, thus lowering the average rate for all investors. Then, if rates begin to rise, the hot money will often leave, forcing the fund (and long-term investors in it) to suffer trading costs and capital losses that can’t be “waited out.”
On the other hand, an investor who holds individual bonds and is satisfied with the yield to maturity when the bond was purchased, is not subject to the same problem (that is, other investors cannot force him to sell at depressed prices).
I strongly agree with this approach. For clients who are preserving wealth, we recommend bond ladders as a foundation.
Watch out for….
Target date funds. John Authers (FT) explains that if you do not adjust allocations for relative valuations, you can get seriously off course. If you have a financial advisor, this is a basic task. If not, you should verify that the TDF is doing what you want.
Over-reliance on the Shiller CAPE ratio. Acclaimed valuation guru Aswath Damodaran explains why this approach is potentially dangerous, often leading investors astray.
Refinery stocks. Names that may seem cheap on a long-term basis may be under pressure from other factors. Paulo Santos explains the current risks. Few understand this market. We did well when oil prices crashed since many ETFs just lump refiners in with the general oil sector. Quite wrong.
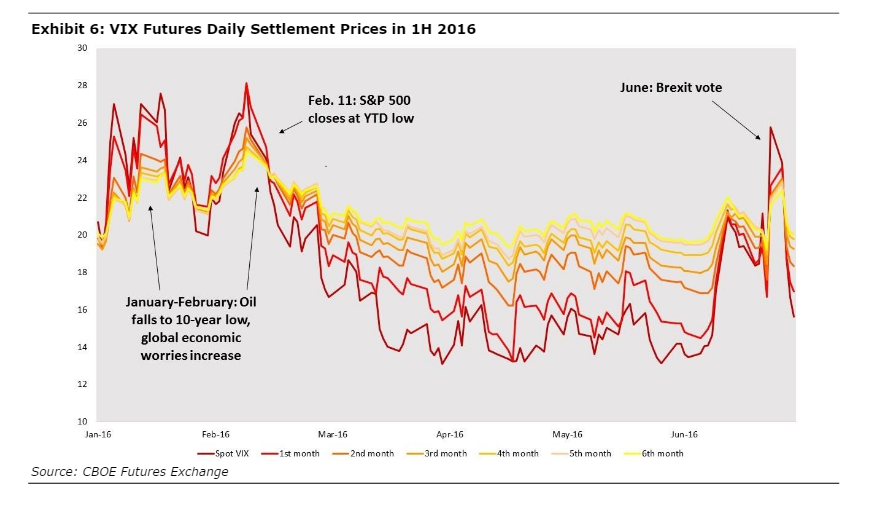
Volatility derivatives. Trading volume has exploded in these products. Traders who are “scared witless” [TM OldProf Euphemism] read a blog post explaining that this is a great way to hedge. Hardly any realize how much the odds are stacked against them. Mark Melin’s article at ValueWalk does a great job of explaining these issues. The chart below summarizes the key point – contango in the futures contracts. If you do not understand the significance of this, you need to do a lot more study before trading these products!
Final Thoughts
The biggest story, now joined by major media sources, is the failure of the Fed efforts at more transparency. Everyone seems to agree that more information has not improved clarity about policy. I have sometimes joined those questioning the communication methods, but always emphasizing a key point:
Transparency ≠ Clarity
If the Fed is data dependent, and the data paint a mixed picture, the immediate policy implications cannot be clear.
Each day I see commentary suggesting that economic data are very weak, but the Fed should be raising rates. Some even suggest that higher rates are needed so the Fed can lower them to fight the next recession. They disagree with the Fed mission to avoid or delay the next recession.
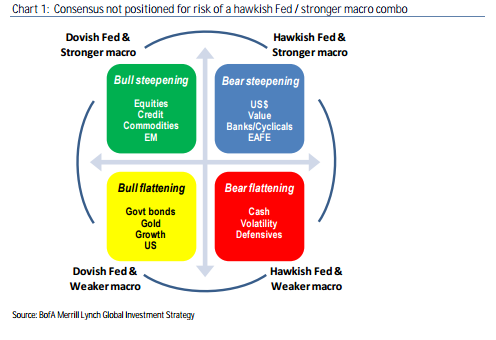
The likely outcome from this is the analysis from Merrill Lynch’s Chief Strategist, Michael Hartnett. His conclusions got a lot of attention this week, including Sara Sjolin (MarketWatch) with the chart below, and also the FT. The latter discusses the Keynesian Put, a concept you will soon be hearing more about.
The bear steepening occurs when a stronger economy raises rates on the long end of the curve. It is bearish for bonds and bond proxies, but very bullish for economically sensitive stocks and banks. We saw some hints of this shift on Friday. Strong economic data, especially tighter labor markets, may (finally) move interest rates higher.

