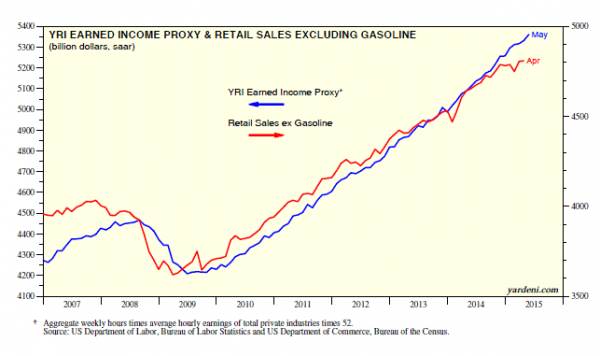
This week’s economic calendar is light on really important data. As always, this invites pundit pontification on what last week’s news means for Fed policy. The fresh news will come from the consumer, especially the retail sales report on Thursday.
Next week’s theme will be:
Is it time for a consumer rebound?
Prior Theme Recap
In my last WTWA I predicted that market discussions would be all about jobs. In addition, I asked whether the news would reignite the interest rate debate.
This was right on all counts. The job discussion started with the release of the auto sales data: Good news for the company workers, encouraging for construction, and indicative better consumer employment. The story continued throughout the week, culminating with Friday’s employment report. In addition, the Fed/interest rate debate launched immediately and played out through Friday.
Feel free to join in my exercise in thinking about the upcoming theme. We would all like to know the direction of the market in advance. Good luck with that! Second best is planning what to look for and how to react. That is the purpose of considering possible themes for the week ahead.
This Week’s Theme
This week’s lighter calendar comes with the context of strength in the most important economic indicators. Finally, there are some strong reports in important indicators. Will there be more? I expect market observers to be asking:
Will consumer spending (finally) reflect the strength in employment?
The Viewpoints
There are two basic viewpoints, but the differences are very sharp.
- The economy is weak, including jobs, income, and spending. Eventually this will drag down stocks, including those most closely tied to consumer spending.
- Economic growth is encouraging. Cautious consumers have lagged in their spending, skeptical of the duration of the rebound. It is time for a change in this trend. (Ed Yardeni cites the possible shift).
And of course, any good news on the economy will be the immediate source of skepticism, since any move by the Fed will quash the rally. Josh Brown’s witty analysis should be required reading for “bad news pundits.”
As always, I have my own ideas in today’s conclusion. But first, let us do our regular update of the last week’s news and data. Readers, especially those new to this series, will benefit from reading the background information.
Last Week’s Data
Each week I break down events into good and bad. Often there is “ugly” and on rare occasion something really good. My working definition of “good” has two components:
- The news is market-friendly. Our personal policy preferences are not relevant for this test. And especially – no politics.
- It is better than expectations.
The Good
There was some very good news.
- The Trade Plan prospects improve. This is a political football and therefore controversial. On a strictly economic basis, it is a policy almost universally favored by economists – and therefore market-friendly. (The Hill).
- PCE inflation remains very tame at up 0.1% on the headline and 1.2% on the core. Staying below and gradually approaching the target implies a moderate change in Fed policy and a longer business cycle.
- OPEC keeps production on track. While bad for some specific stocks, lower oil prices are beneficial for most.
- Forward earnings growth has stabilized. Brian Gilmartin notes the trend and is optimistic. See his analysis for a complete discussion of sector contributions and what to expect.
- Auto Sales — the best in ten years. This is a good sign for consumer spending as well is employment. Ford (NYSE:F) is skipping the normal summer plant closings.
- ISM manufacturing beat expectations with a reading of 52.8
- Construction spending increased 2.2%, to the highest level in six years.
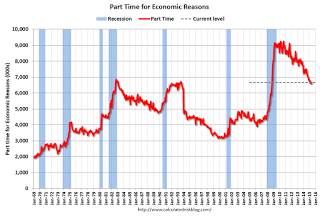
- Employment gains remained solid. The employment news showed strength on the payroll number, improved labor force participation, a better hourly wage, and reduced part-time work for non-economic reasons. Employment continues to show growth typical of a solid expansion. (Calculated Risk).
The Bad
The news also included some negatives.
- ISM services missed expectations, recording the lowest reading in over a year at 55.7. Still a reasonable expansion.
- Personal spending showed no increase.
- Q1 productivity was revised down to -3.1%. This is mostly a reflection of the Q1 GDP adjustments, but it bears watching.
- No progress on Greece – but we don’t really expect any until month’s end.
- Factory orders were revised lower, showing a larger decline in April.
The Ugly
Information and analysis compression. In the baby boomer era, Walter Cronkite took note that most people got their news from television – and were therefore seriously uninformed. Boomers are still watching TV for news. I wonder what he would think now. More than 60% of millennials rely upon Facebook (NASDAQ:FB).
I guess this is more serious study than required by Twitter, since you can write a longer post. (This week saw a new record-holder for fastest to one million Twitter (NYSE:TWTR) followers. You can probably guess who!)
Consumers of all information want to spend less time and avoid thought. This is a frightening prospect. Some ideas might be conveyed in 140 characters, but most cannot.
The Silver Bullet
I occasionally give the Silver Bullet award to someone who takes up an unpopular or thankless cause, doing the real work to demonstrate the facts. Think of The Lone Ranger. Normally I see a specific erroneous analysis and someone who provides refutation. Let us not be a slave to specificity.
Morgan Housel provides something more powerful that a single specific point. He explains how so many abuse historical interpretation to prove their point — whatever it is.
Take these two statements:
“11 million jobs have been created since 2009. The stock market has tripled. The unemployment rate nearly cut in half. The U.S. economy has enjoyed a strong recovery under President Obama.”
“The recovery since 2009 has been one of the weakest on record. The national debt has ballooned. Wages are stagnant. Millions of Americans have given up looking for work. The economy has been a disappointment under President Obama.
Both of these statements are true. They are both history. Which one is right?
It’s a weird question, because history is supposed to be objective. There’s only supposed to be one “right.”
But that’s almost never the case, especially when an emotional topic like your opinion of the president is included. Everyone chooses the version of history that fits what they want to believe, which tends to be a reflection of how they were raised, which is different for everybody. We do this with the economy, the stock market, politics — everything.
It can make history dangerous. What starts as an honest attempt to objectively study the past quickly becomes a field day of confirming your existing beliefs.
There is a lot of Silver Bullet refutation packed into this analysis. It is a guide to critical thinking about most of what you read – those two variable charts, simple historical analyses, and confusion of political beliefs with investor objectivity.
Quant Corner
Whether a trader or an investor, you need to understand risk. I monitor many quantitative reports and highlight the best methods in this weekly update. For more information on each source, check here.
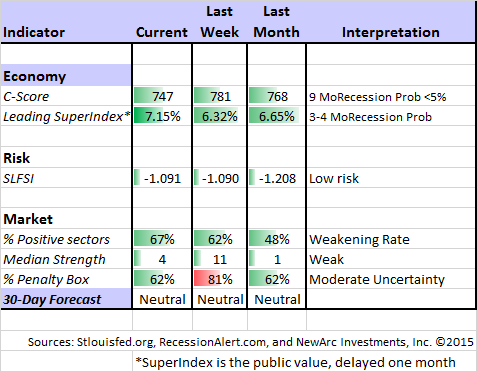
Recent Expert Commentary on Recession Odds and Market Trends
Bob Dieli does a monthly update (subscription required) after the employment report and also a monthly overview analysis. He follows many concurrent indicators to supplement our featured “C Score.”
RecessionAlert: A variety of strong quantitative indicators for both economic and market analysis. While we feature the recession analysis, Dwaine also has a number of interesting market indicators. He recently noted an increase in his combined measure of economic stress, although the levels are still not yet worrisome.
Doug Short: An update of the regular ECRI analysis with a good history, commentary, detailed analysis and charts. If you are still listening to the ECRI (3½ years after their recession call), you should be reading this carefully. This week the ECRI finally admits to the error in their forecast, but still claims the best overall record. This is simply not true. I rejected their approach in real time during 2011 and also highlighted competing methods that were stronger. Until we know what is inside the black box (I suspect excessive reliance on commodity prices and insistence on unrevised data) we will be unable to evaluate their approach. Also see Doug’s important Big Four summary of key indicators, updated regularly.
Georg Vrba: has developed an array of interesting systems. Check out his site for the full story. We especially like his unemployment rate recession indicator, confirming that there is no recession signal.
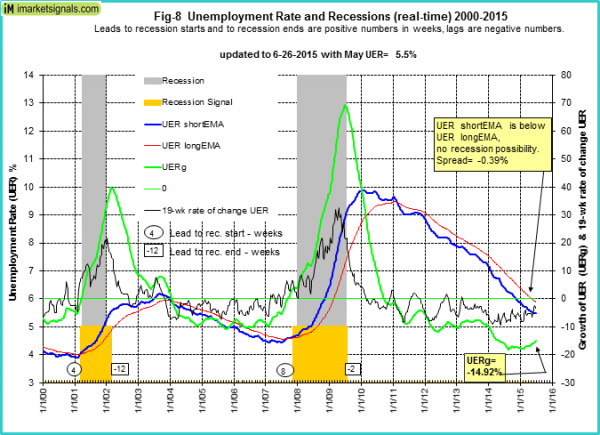
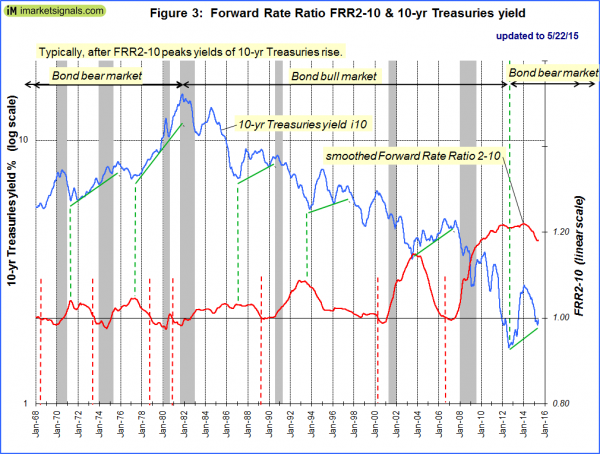
He gets a similar result from the Business Cycle Indicator. Georg continues to develop new tools for market analysis and timing, including a combination of models to do gradual shifting to and from the S&P 500. His latest idea uses the yield curve (2-10) as an indicator for stocks, bonds and recessions. You need to read the entire piece carefully for an explanation, but here is an example for the bond market indicator.
The Week Ahead
There are fewer reports than usual this week, with a focus on housing.
The “A List” includes the following:
- Retail sales (Th). Time for a consumer rebound?
- JOLTS report (T). Especially important because of information on employment structure. Pundits fail on this.
- Initial jobless claims (Th). The best concurrent news on employment trends, with emphasis on job losses.
- Michigan Sentiment (F). Best take on job creation on potential spending. Any rebound?
The “B List” includes the following:
- PPI (F). Inflation data remains of lesser significance. Until it heats up – and for more than a month or two – it will have little influence on Fed policy.
- Business inventories (Th). April data will have some effect on Q2 GDP. Difficult to interpret.
- Wholesale inventories (T). See business inventories.
It is a light week on the Fed schedule. We might get news from Greece, but I am not expecting much for a couple of weeks.
How to Use the Weekly Data Updates
In the WTWA series I try to share what I am thinking as I prepare for the coming week. I write each post as if I were speaking directly to one of my clients. Each client is different, so I have five different programs ranging from very conservative bond ladders to very aggressive trading programs. It is not a “one size fits all” approach.
To get the maximum benefit from my updates you need to have a self-assessment of your objectives. Are you most interested in preserving wealth? Or like most of us, do you still need to create wealth? How much risk is right for your temperament and circumstances?
My weekly insights often suggest a different course of action depending upon your objectives and time frames. They also accurately describe what I am doing in the programs I manage.
Insight for Traders
Felix continued a neutral stance for the three-week market forecast. The confidence in the forecast remains rather modest, reflected by the high percentage of sectors in the penalty box. Despite the overall market verdict Felix has generally been fully invested. For more information, I have posted a further description — Meet Felix and Oscar. You can sign up for Felix’s weekly ratings updates via email to etf at newarc dot com. Felix appears almost every day at Scutify (follow him here).
Interested in intra-day trading? Alan Farley has plenty of ideas for finding setups. Plan to spend some time checking out links to explanations and other sources.
10 Reasons Traders Lose Money in the Market (Steve Burns at See It Market). The conclusion captures the essence, but the list items are well worth thinking about.
Long-term, successful traders have many common characteristics: They religiously follow a plan, they have an edge over the majority of market participants, risk management and capital preservation is their number one priority, and they go with the flow of the price action rather than predict. They also admit they are wrong quickly, and never quit learning.
Insight for Investors
I review the themes here each week and refresh when needed. For investors, as we would expect, the key ideas may stay on the list longer than the updates for traders. Major market declines occur after business cycle peaks, sparked by severely declining earnings. Our methods are focused on limiting this risk. Start with our Tips for Individual Investors and follow the links.
We also have a page summarizing many of the current investor fears. If you read something scary, this is a good place to do some fact checking.
Other Advice
Here is our collection of great investor advice for this week.
Featured Commentary
Check out part one of my new series on risk. Early reactions were good, and more comments are welcome. At least three more installments are planned.
Personal Finance
Professional investors and traders have been making Abnormal Returns a daily stop for over ten years. The average investor should make time – at least — for a weekly trip on Wednesday. Tadas always has first-rate links for investors in this special edition. I especially liked this link from Ben Carlson, on How to Tell If You’re Getting Bad Financial Advice.
Stock Ideas
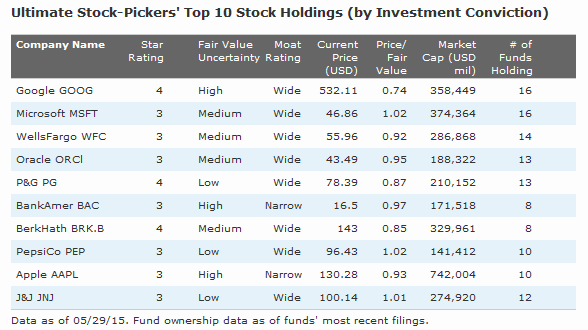
The top conviction stocks from the funds selected as part of the Morningstar Ultimate Stock Picker team. Read the full article for more tables and discussion.
Twelve takeover targets from Goldman. (Jeff’s comment: I look at these lists for ideas, but never buy just on takeover speculation. It is a nice kicker, and might show something about the overall attractiveness of the sector. Interesting reading).
Sector Themes
- Five sectors in the “gravest danger” if rates rise. (Tim Clift, MarketWatch).
- Oil to stay cheap? So says Fortune. Production is not being cut enough.
Market Outlook: More Bubble Talk
Here is an interesting contrast – another round in the Shiller vs. Siegel debate.
Final Thought
Last week might represent a 2015 turning point for economic data. After another soft patch to start the year, many factors seem to have changed. If the trend in the important data spreads to consumption, housing, and business investment, we might still see some robust growth as part of the current business cycle.
Meanwhile, my theme for this year – reversing last year’s winners and losers in stock sectors – continues to look promising.
Those on the right side of the macro trend can gain both from the overall market and the sector rotation.
Personal Note
I try to publish WTWA in time for Sunday reading, since I know that works best. Some events, like the wedding and funeral gatherings of the last two weeks, require a change in schedule. I hope to be back on track next week.

