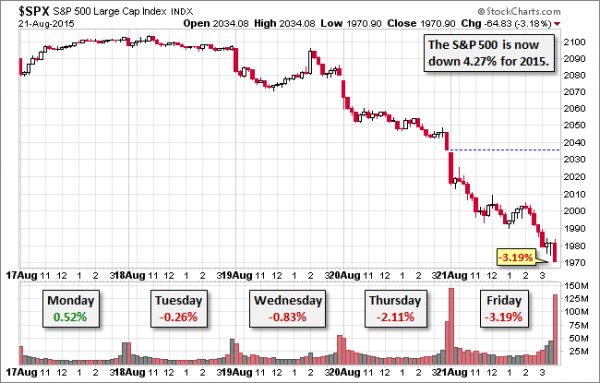
The big market decline has the attention of everyone, even those who do not closely follow the markets. The coming week will start with the punditry asking:
Is the market decline the start of something big?
Prior Theme Recap
In my pre-vacation WTWA I predicted a rather wonkish theme, wondering whether economic data would confirm the negative message from the commodity markets. The guess about the topic was accurate and the answer was “no.” Economic data have continued to show modest growth. This made no difference, since actual economic data remains in disfavor. (Check here for my further thoughts on this theme).
As he does each week, Doug Short’s recap explains the story and his great weekly snapshot lets you see it at a glance. With the ever-increasing effects from foreign markets, you might add Doug’s World Markets Weekend Update to your reading list. The decline in the last 2 ½ trading days wiped out the year’s gains in stocks.
We would all like to know the direction of the market in advance. Good luck with that! Second best is planning what to look for and how to react. That is the purpose of considering possible themes for the week ahead. You can try it at home.
This Week’s Theme
This coming week will start with a general debate about whether we saw a selling climax or whether there is more in store.
Observers will be asking (quite differently from the hopeful message of the old Steve Allen theme song): Is this the start of something big?
…and for some… Will the Fed send a message at Jackson Hole?

Courtesy: Investing.com
The Viewpoints
The conclusions about the current market message include a wide spectrum
- This is the start of the big one. Everything you have been warned about valuation, omens, and world news has finally come true. I even saw a “Dow 5000” piece.
- This is a normal and expected correction in stock prices – perhaps overdue. This article from Chalres Schwab (also presented on PBS Friday night) reflects solid mainstream advice.
- Expect a rebound. Investors are scared and that is a condition for a bottom. (Jeff Saut via William Watts at MarketWatch).
As always, I have my own ideas in today’s conclusion. But first, let us do our regular update of the last week’s news and data. Readers, especially those new to this series, will benefit from reading the background information.
Last Week’s Data
Each week I break down events into good and bad. Often there is “ugly” and on rare occasion something really good. My working definition of “good” has two components:
- The news is market-friendly. Our personal policy preferences are not relevant for this test. And especially – no politics.
- It is better than expectations.
The Good
There was some good economic news. During my vacation there was some mostly good news – solid on employment, strong on auto sales, and very strong on housing. The divergence between economic fundamentals and the market has increased.
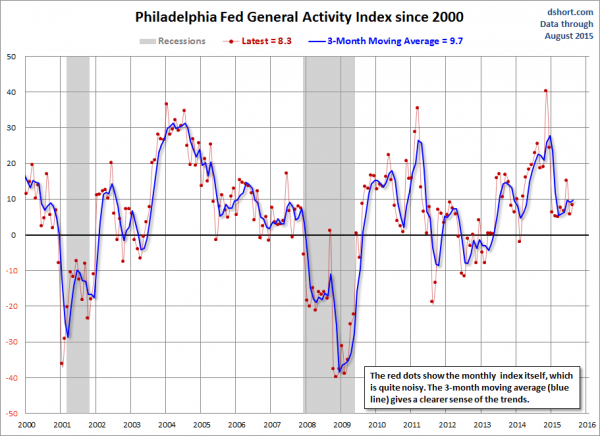
- The Philly Fed beat expectations. I am giving the report more attention based upon the recognition accorded it in recent academic research. Let us start with a long-term perspective from Doug Short and Jill Mislinski.
- Inflation remains benign, with the CPI showing an increase of only 0.1%.
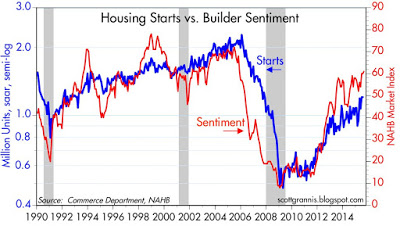
- Housing starts were strong and beat expectations. Scott Grannis includes the data as part of a general economic update along with the expected charts.
- Fed minutes got a dovish interpretation. This seemed to have only a small and transitory market effect. Has the market appetite for a rate increase shifted? Fed expert Tim Duy has his typically strong analysis of the evidence with the honest conclusion that a rate move is probably a coin toss.
The Bad
There was also some negative data last week.
- Leading economic indicators turned negative. The Conference Board still expects moderate economic growth through the rest of the year. Steven Hansen of GEI is skeptical, citing some other sources.
- Building permits plummeted. Some of the decline may reflect the end of certain stimulative concessions in New York which had a pull-forward effect last month.
- The preliminary flash China PMI was 47.1, down from 47.8. This sparked trillions of dollars’ worth of selling. As far as I can tell, this has become the only piece of data from China that the market accepts as accurate! Isabella Kaminska of the FT has a nice article on interpreting Chinese economic data. This topic needs much more analysis. I have a lot of material on China, but it is too much for the weekly update.
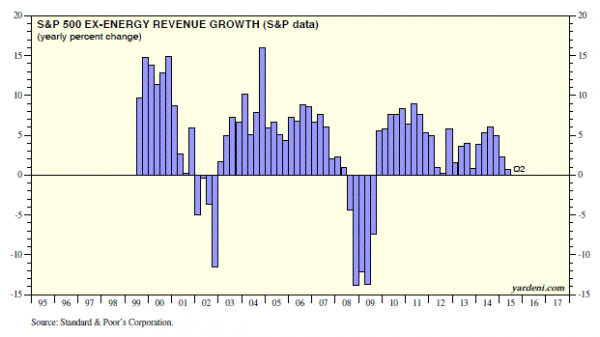
- Corporate revenue growth has stalled. Dr. Ed has the story, summarized by this chart:
The Ugly
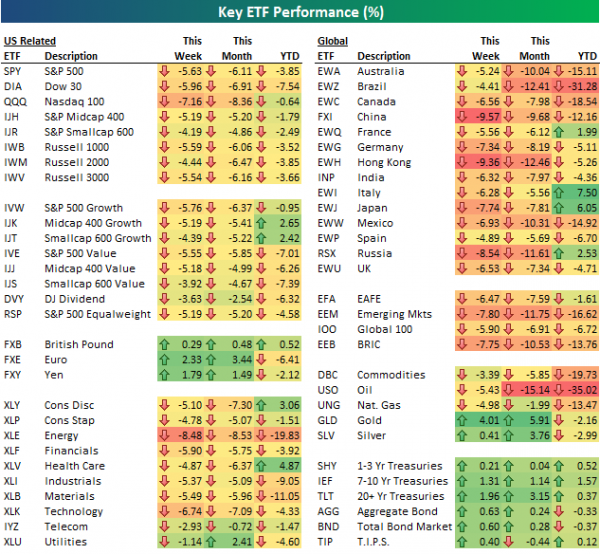
The ugly award must go to the stock market, with massive selling in all sectors. Bespoke shows the widespread nature of the rout with this chart of ETF results:
The Silver Bullet
I occasionally give the Silver Bullet award to someone who takes up an unpopular or thankless cause, doing the real work to demonstrate the facts. Think of The Lone Ranger.
This week’s award goes to Barry Ritholtz for his analysis of the Death Cross, which happens when the 50-day moving average moves below the 200-day moving average. Drawing upon strong sources and running down the details, Barry continues his excellent series of posts on deceptive indicators. In this case, the results show a slight positive return after this event, but too small to use as a foundation for decisions.
Noteworthy
Sometimes a chart is best in helping to keep perspective. This one shows the size of the various world stock markets. (B of A via BI).

Quant Corner
Whether a trader or an investor, you need to understand risk. I monitor many quantitative reports and highlight the best methods in this weekly update. For more information on each source, check here.
Recent Expert Commentary on Recession Odds and Market Trends
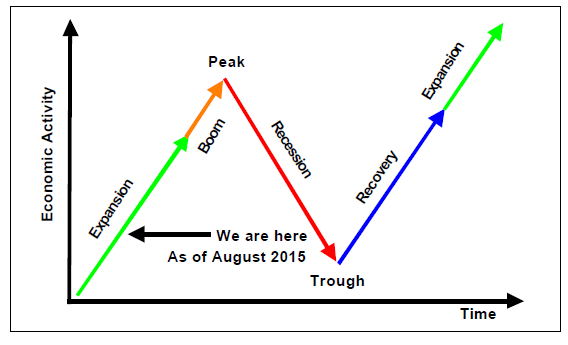
Bob Dieli does a monthly update (subscription required) after the employment report and also a monthly overview analysis. He follows many concurrent indicators to supplement our featured “C Score.” Here is his recent chart of where we are in the business cycle. He has an excellent new report on “long” economic cycles. I will try to get permission for our readers to get some excerpts.
Georg Vrba: An array of interesting systems. Check out his site for the full story. We especially like his unemployment rate recession indicator, confirming that there is no recession signal. He gets a similar result from the Business Cycle Indicator. Georg continues to develop new tools for market analysis and timing, including a combination of models to do gradual shifting to and from the S&P 500.
Doug Short: Provides an array of important economic updates including the best charts around. One of these is monitoring the ECRI’s business cycle analysis. Jill Mislinski has joined Doug’s team and provides this week’s update.
RecessionAlert: A variety of strong quantitative indicators for both economic and market analysis. While we feature the recession analysis, Dwaine also has a number of interesting systems. These include approaches helpful in both economic and market timing. He has been very accurate in helping people to stay on the right side of the market.
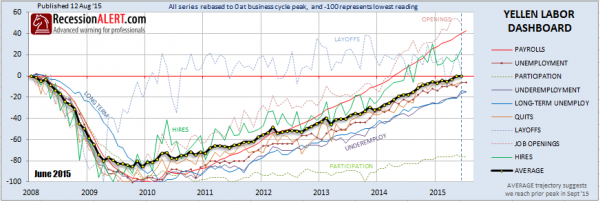
Dwaine has a special feature analyzing the elements of Fed Chair Yellen’s “labor dashboard.” His conclusion is that the time to move is upon us. Check out the analysis accompanying this chart:
The Week Ahead
It is another big week for economic data. This news has receded in recent importance, but eventually our study will pay off.
The “A List” includes the following:
- New home sales (T). Important sign for construction and the economy.
- PCE prices (F). The Fed’s favorite inflation indicator.
- Consumer confidence (T). Conference Board version gives coincident information on jobs and some leading info on spending.
- Michigan sentiment (F). Does the same as the Conference Board survey but includes an ongoing panel as part of the sample.
- Personal income and spending (F). July data, but covering a key economic segment.
- Initial jobless claims (Th). The best concurrent news on employment trends, with emphasis on job losses.
The “B List” includes the following:
- Pending home sales (Th). A read on the housing sector, but without the direct significance of new home sales.
- Durable goods orders (W). Important in the long run, but July data in this volatile series is a bit stale.
- GDP revision for Q2 (Th). This is “old news” by now, but it still provides a baseline for interpreting growth. Higher numbers are expected and there will be discussion about Q3 as well.
- Crude oil inventories (W). Current interest in energy keeps this on the list of items to watch.
The Fed Jackson Hole conference will be in the news by week’s end. The key speech will come from Vice Chairman Stanley Fischer, but that is not scheduled until Saturday. Chair Yellen will not attend. It will be in time for the next installment of WTWA, but not for trading.
How to Use the Weekly Data Updates
In the WTWA series I try to share what I am thinking as I prepare for the coming week. I write each post as if I were speaking directly to one of my clients. Each client is different, so I have five different programs ranging from very conservative bond ladders to very aggressive trading programs. It is not a “one size fits all” approach.
To get the maximum benefit from my updates you need to have a self-assessment of your objectives. Are you most interested in preserving wealth? Or like most of us, do you still need to create wealth? How much risk is right for your temperament and circumstances?
My weekly insights often suggest a different course of action depending upon your objectives and time frames. They also accurately describe what I am doing in the programs I manage.
Insight for Traders
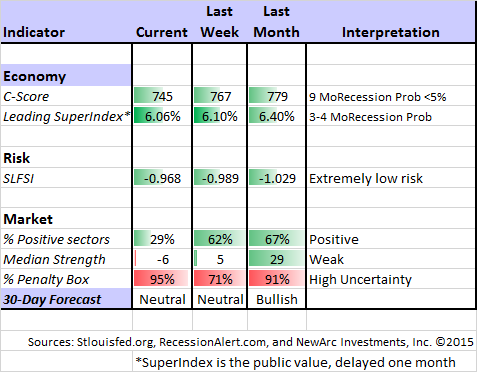
Felix has continued in “neutral.” The confidence in this three-week forecast remains very low with the continuing extremely high percentage of sectors in the penalty box. Felix has (unfortunately) remained fully invested, including some foreign exposure, because there are still several attractive sectors. The inverse funds, bonds, and gold recently moved up the rankings, but never hit the top three, the point where we would trade them. For more information, I have posted a further description — Meet Felix and Oscar. You can sign up for Felix’s weekly ratings updates via email to etf at newarc dot com. Felix appears almost every day at Scutify (follow him here).
There are some provocative trading ideas this week from two of my favorite sources.
- Dr. Brett notes that he successfully deviated from his current trading playbook on Friday? Why? He has a “meta model” that helps to identify when things might have changed. Read the entire article. Then read it again. This is difficult to do properly.
- Charles Kirk (another favorite source requiring a small and easily-recovered subscription price) always has a flexible game plan. Last week he noted that the normal options expiration week rally pattern was breaking down. This left a lot of “hot money” on the wrong side of the trade.
I commented on Scutify that this action brings many options back to life when pros have already written them off. It is the opposite of a short-covering rally. Many traders were short puts. Rapid declines added dramatically to the “gamma” of these options, forcing traders to cover.
Insight for Investors
I review the themes here each week and refresh when needed. For investors, as we would expect, the key ideas may stay on the list longer than the updates for traders. Major market declines occur after business cycle peaks, sparked by severely declining earnings. Our methods are focused on limiting this risk. Start with our tips for Individual Investors and follow the links.
We also have a page summarizing many of the current investor fears. If you read something scary, this is a good place to do some fact checking.
Other Advice
Here is our collection of great investor advice for this week.
If I had to pick a single most important article, it would be this brief piece by Mark Dow. He takes the central problem of the current market and analyzes it in simple terms. He notes that many smart analysts get too confident and use their intelligence to “explain” things in their own terms. It is more challenging (but more rewarding) to find the best sources, realizing that you do not have the answer to everything.
In today’s environment, the anchor themes are two.
1. Disaster Myopia. We are still living in the long shadow of the global financial crisis. Six years have passed, but we still return to ‘that place’ far too quickly. Worst case scenario, daily. This ease of recall induces us to over forecast tail events—even if Macroggeddon is 0 for 500 by now. Erring on the side of optimism is still the money trade.
2. Longest, shallowest cycle ever. The world continues its deleveraging. The US appears to be leading the rest of the world in the process. But the extrapolation of growth optimism on which all cycles end is just not there in the US—or anywhere else for that matter. And it doesn’t seem imminent, either. This implies two things: (1) the odds of a new recession in the US are low (you can’t commit suicide jumping out of the basement window), and (2) since bear markets typically come when economic cycles turn, a bear market in US equities is unlikely until the economy gets jacked up on excessive investment and hiring.
The “basement window” comment fits our featured analysis from Bob Dieli quite well!
Stock Ideas
Energy or Utilities? While those are not the only two choices, Eddy Elfenbein notes that they seem to define the risk-on, risk-off mentality of recent trading. Here is his full matrix:
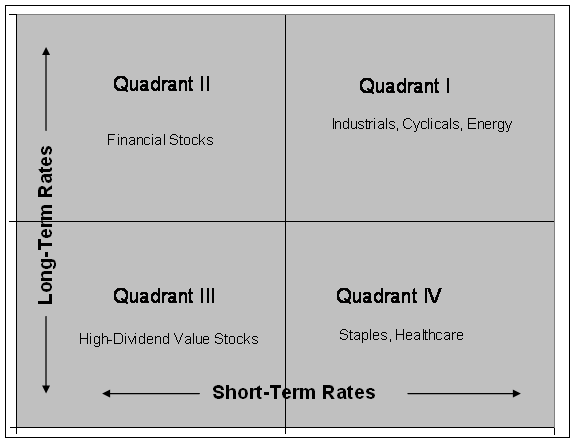
U.S. Steel “looks like a steal” according to Barron’s. (Sandra Ward). There are a number of interesting ideas in this week’s issue, but “Steel” (NYSE:X) as traders call it is a great example of the current market chaos. The stock fell in the wake of the yuan devaluation without much careful thought by investors. There is a lot of knee-jerk reaction to events and trading of ETFs without analysis of individual stocks. Algorithms are based on historical market reactions, not fundamentals. The market is littered with such opportunities right now.
Personal Finance
Professional investors and traders have been making Abnormal Returns a daily stop for over ten years. The average investor should make time (even if not able to read every day as I do) for a weekly trip on Wednesday. Tadas always has first-rate links for investors in this special edition. As always, there are several great links, but I especially liked this message from David Merkel about the need for a financial buffer. Many get discouraged at the recommendation for six months of savings. As with so many things, just getting started is important. Great advice!
Economic Outlook
As usual, Josh Brown has a colorful and entertaining style as he explains the current market worries. Read it all, but here is my favorite point:
I bring you terrible news.
Oil prices have plunged to the point where it hasn’t been this cheap to fill up your gas tank in over a decade. Businesses that count energy as an input cost will be forced to figure out what to do with the excess capital they’re not spending on fuel.
Speaking of excess capital, American corporations are struggling under the burden of enormous piles of cash they don’t have a use for. Each day they must choose between shrinking their floats or handing money back to shareholders in the form of record dividends.
Meanwhile, corporate profit margins are at risk now that companies are being pressured to pay the U.S. workforce a higher wage. These improved wages may result in greater consumption and demand for products and services, not to mention the spectre of revenue growth. Executives are horrified.
Look out Andy Borowitz!
Final Thought
No one likes to see significant losses in their portfolio. It creates an emotional climate that leads most to do exactly the wrong thing. Investors are “stampeding out of stocks.” If you are only now asking the “start of something big” question, you do not have a plan.
That is why I did my recession project in 2011 and also added the St. Louis Financial Stress Indicator. These tools have reliably provided a multi-month warning of the major declines (40-50%) that come with recessions. If I knew of a successful method for predicting the 10-20% moves I would embrace it. I have investigated many such claims, but none of them stood up to our testing. Nominations are always welcome.
I discussed these themes in more detail in this past week’s post on Rebuilding the Wall of Worry, a concept that few really understand.
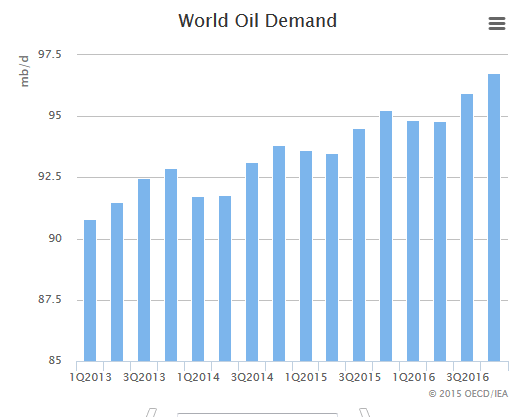
The indicators tell us that we do not see the signs normally associated with a large market decline. Instead we see a parade of pundits saying “China, oil prices, and the Fed” because their job is to “explain” every market move. Here is a little test. If oil prices are signaling an incipient recession, how much do you think oil consumption has declined in the last year?
If you sense a trap, you are right. Last year marked the biggest rate of increase in five years. The IEA has a nice interactive chart, depicted below. The price decline comes from increases in supply and the fact that none of the suppliers is backing off. Also noteworthy is that the gap is only about 1%. The oil price data are reflecting almost nothing about the world economy, despite the daily drumbeat in the news.
Investment Conclusion
I do not have any idea whether Friday’s selling marked capitulation and a near-term market bottom. (Neither does anyone else). I can imagine some panicked retail investors selling on Monday’s opening. Art Cashin says that China was the cause of 70% of the selling (!!) and we all need to see whether the People’s Bank of China does something on Sunday. Sheesh! If this is really what the NYSE trading floor is thinking about, the chasm between markets and the economy has reached a new level.
I was patient during last week’s declines, but we did some buying for all of our programs on Friday. Individual investors might consider whether the price decline means that an increased stock allocation is appropriate. There are plenty of good opportunities.
I especially like the stocks that have absolutely nothing to do with China or energy, yet were caught up in the general selling. Noah Blackstein, a very sharp and successful fund manager is one of the few who get our highest office honor (turn off the mute and scroll back on TIVO to watch). In an interview he observed that everything was getting thrown out with the bath water in a market that just “wanted to go down.” He says that it became a self-fulfilling prophecy, and specifically mentioned homebuilders. Here is the link to his excellent interview.

