The calendar continues in something of an alternating mode. Last week had plenty of important data; this week has little. Instead we get multiple speeches from Fed Presidents and Governors and the release of the last FOMC minutes. Little data plus lots of Fed news is a natural draw for the punditry. This week they will be asking:
Is the Fed too optimistic?
Prior Theme Recap
In my last WTWA I predicted a week chock-full of data with a focus on the market reaction. Would good news finally be treated as good? That was a popular topic throughout the week, from Chair Yellen’s speech to Friday’s employment report. Before the opening on Friday, pundits were observing that the solid data was sending stocks lower. By day’s end the S&P 500 had reversed course, despite weakness in oil prices. The answer to last week’s question is a very tentative “yes.” Doug Short has the full story with an emphasis on April Fool’s Day in his excellent weekly chart. (With the ever-increasing effects from foreign markets, you should also add Doug’s World Markets Weekend Update to your reading list).
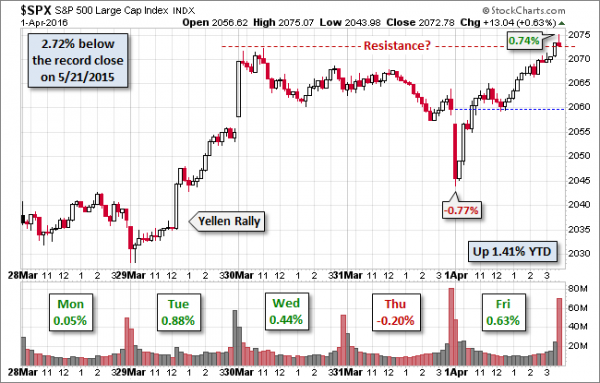
Doug’s update also provides multi-year context. See his full post for more excellent charts and analysis.
We would all like to know the direction of the market in advance. Good luck with that! Second best is planning what to look for and how to react. That is the purpose of considering possible themes for the week ahead. You can make your own predictions in the comments.
This Week’s Theme
The economic calendar has few important reports. Once again, the Fed participants will be out in force. The minutes from the last FOMC meeting will be released. Chair Yellen joins a panel discussion with three past Fed chairs. It is a paradise for pundits. They can spend the entire week on the Fed, their favorite topic. With the background of last week’s news the discussion might have a little more focus. In particular many will be asking:
Is the Fed too optimistic?
Background
There is a huge divergence in opinion about the economy. The data tell one story. Opinion tells another. Compare these two Gallup surveys:
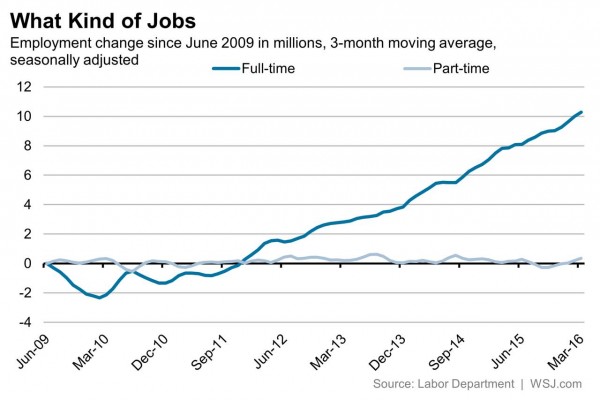
Employment data show strength on every measure. Under-employment is a typical example.
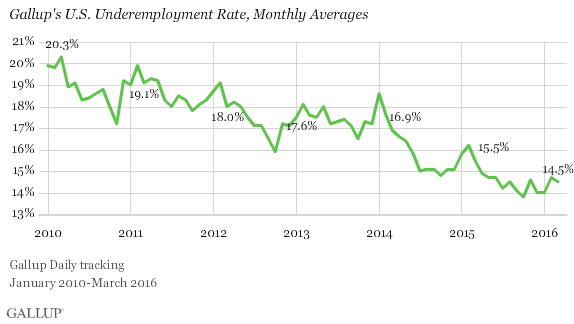
Meanwhile, 29% of Gallup respondents rate current conditions as “poor” and 58% think things are getting worse.
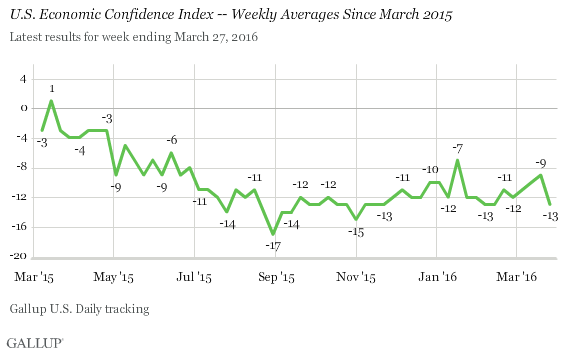
Are these opinions too pessimistic?
MRB Partners recent update notes the unwinding of recession fears and the strength of recent data. They suggest that economic surprises will mean upside for stocks and risk for bonds.
Who will be correct?
Viewpoints
The basic themes are familiar.
- The Fed has painted itself into a box. (TM OldProf mixed metaphor). There is no hope.
- The Fed has been too optimistic for many years. What is new?
- The Fed is over-emphasizing markets rather than the economy.
- The Fed is not clearly communicating plans.
- The Fed is making appropriate changes, based upon the data.
- Fed policy really does not matter much. All of the paths are similar.
- Nothing matters except oil prices.
Challenge Revisited
Your conclusion about how stocks will react is a function of what you believe is driving current market action. We do not get paid for knowing yesterday’s news, but it is important to understand the sources of market reaction.
Last week I suggested a challenge for the week ahead: Would commentators turn to “window dressing” as an explanation for any strength? Friday provided an even better test. In the morning, after all of the key data had been released, pundits observed that “good news was bad.” By the end of the day both the story and the explanations had changed!
The question now is whether Friday’s trading signaled a change in market tone – a willingness to take positive news at face value.
As always, I have my own opinion in the conclusion. But first, let us do our regular update of the last week’s news and data. Readers, especially those new to this series, will benefit from reading the background information.
Last Week’s Data
Each week I break down events into good and bad. Often there is an “ugly” and on rare occasion something really good. My working definition of “good” has two components:
- The news is market-friendly. Our personal policy preferences are not relevant for this test. And especially – no politics.
- It is better than expectations.
The Good
There was good news in a big week for data.
- Chair Yellen tilted in a more dovish direction, an apparent change from recent commentary. Eddy Elfenbein has key quotes from the speech and a nice explanation. And here is the speech for your own review.
- High-frequency indicators are stronger, suggesting the end of the “shallow manufacturing recession.” New Deal Democrat’s weekly must-read update of indicators has the whole story.
- ISM manufacturing turned positive and also beat expectations.
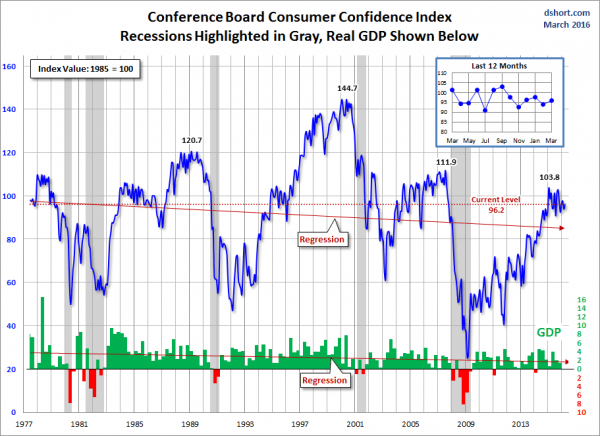
- Consumer confidence increased to 96.2, beating expectations. Jill Mislinski has the story and this chart:
- Pending home sales rose 3.5%. Calculated Risk has the story.
- Employment gains of 215,000 were solid, as was the ADP private payroll increase of 200K. With the household survey confirming, labor participation higher, full-time employment versus part-time improving, and wages increasing, it was difficult to find something to complain about. The WSJ has the story in fourteen charts, including this one:
The Bad
Some of the news was negative.
- Consumer spending disappointed with revisions and small gains. Jeffry Bartash explains what this means for Q1 GDP.
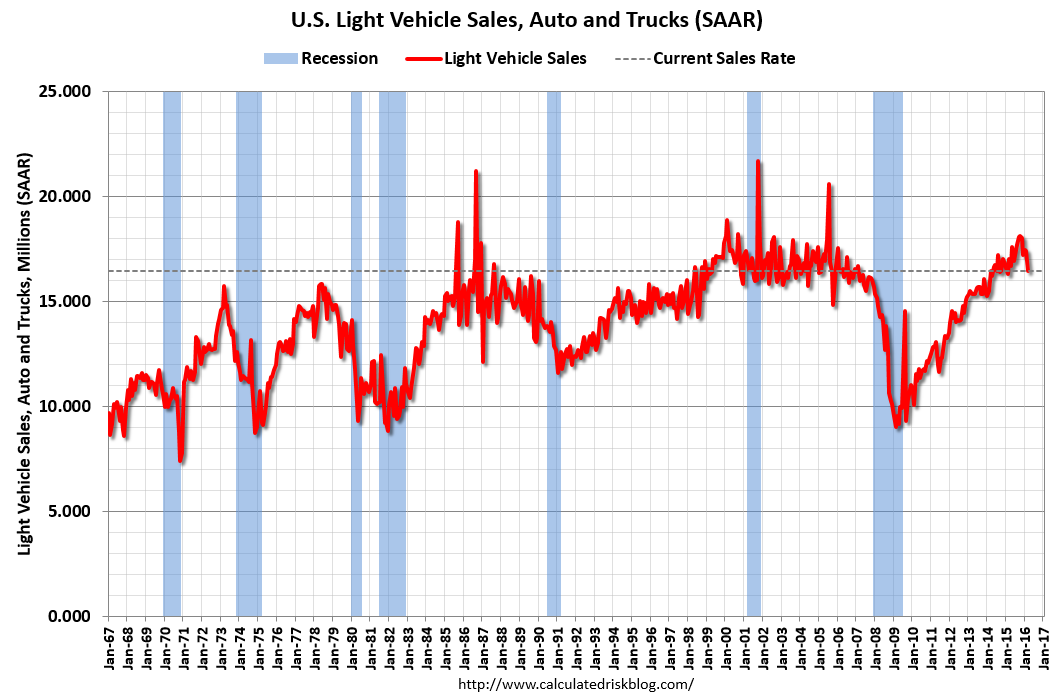
- Auto sales disappointed. Calculated Risk notes a SAAR of 16.45 versus expectations of 17.6. Eddy Elfenbein observed the ten-year high in Ford (NYSE:F) sales, not enough to please the market.
- Construction spending missed expectations with a loss of 0.5%. It is a volatile series. Steven Hansen takes a deeper look.
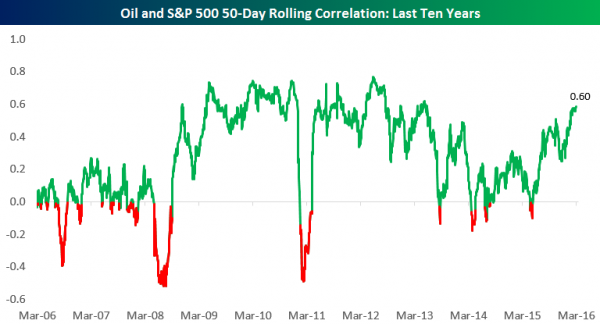
- The oil/equity correlation continues. Bespoke illustrates.
The Ugly
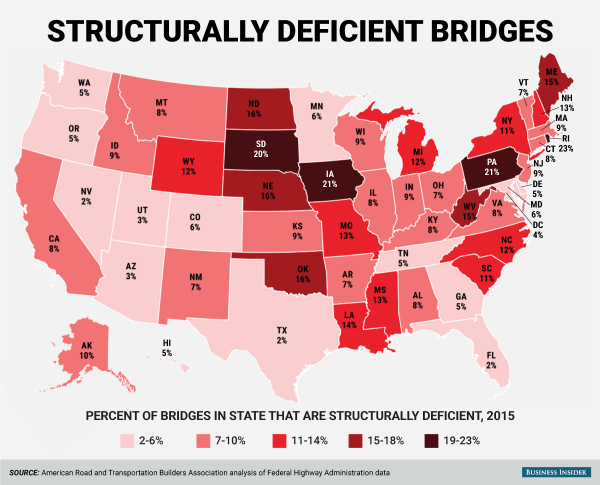
Infrastructure is deteriorating due to lax maintenance since the financial crisis. The latest example concerns structural deficiency in bridges (winning by a nose over Chicago public schools and colleges).
The Silver Bullet
I occasionally give the Silver Bullet award to someone who takes up an unpopular or thankless cause, doing the real work to demonstrate the facts. Think of The Lone Ranger. This week’s award goes to Tim Duy for his work on the economic effects of lower oil prices. This is an important subject for both traders and investors. Nearly everyone expected a stimulus from lower prices, the opposite of the “tax” from prior years. When the result did not develop, it launched a massive and misguided search for explanations, which I described here.
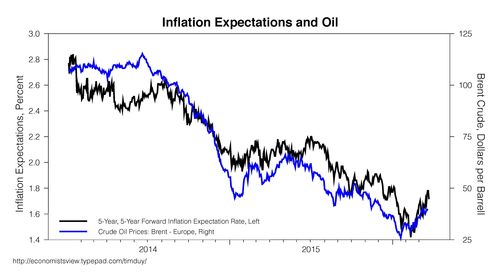
Taking on each specific argument is a challenge. Prof. Duy does a great job of analyzing and explaining a complicated subject. His series of charts makes the argument accessible for a general audience. He highlights some of my regular complaints in this comment and charts from the original source and his own expansion:
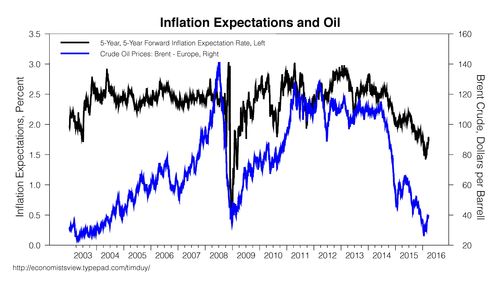
This problem, however, just scratches the surface. Look at either of the first two charts above and two red flags should leap off the screen. The first is the different scales, often used to overemphasize the strength of a correlation. The second is the short time span, often used to disguise the lack of any real long term relationship (I hope I remember these two points the next time I am inclined to post such a chart).
Consider a time span that encompassed the entirety of the 5-year, 5-year forward inflation expectations:
Well done!
Quant Corner
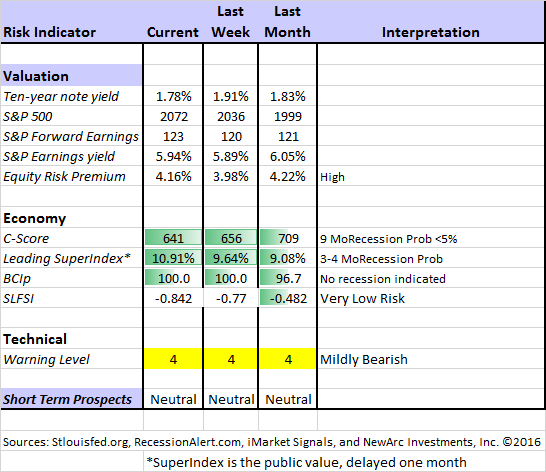
Whether a trader or an investor, you need to understand risk. I monitor many quantitative reports and highlight the best methods in this weekly update. Beginning last week I made some changes in our regular table, separating three different ways of considering risk. For valuation I report the equity risk premium. This is the difference between what we expect stocks to earn in the next twelve months and the return from the 10-Year Treasury note. I have found this approach to be an effective method for measuring market perception of stock risk. This is now easier to monitor because of the excellent work of Brian Gilmartin, whose analysis of the Thomson-Reuters data is our principal source for forward earnings.
Our economic risk indicators have not changed.
In our monitoring of market technical risk, I am now using our new model, “Holmes”. Holmes is a friendly watchdog in the same tradition as Oscar and Felix, but with a stronger emphasis on asset protection. We have found that the overall market indication is very helpful for those investing or trading individual stocks. The score ranges from 1 to 5, with 5 representing a high warning level. The 2-4 range is acceptable for stock trading, with various levels of caution.
The new approach improves trading results by taking some profits during good times and getting out of the market when technical risk is high. This is not market timing as we normally think of it. It is not an effort to pick tops and bottoms and it does not go short.
Interested readers can get the program description as part of our new package of free reports, including information on risk control and value investing. (Send requests to info at newarc dot com).
In my continuing effort to provide an effective investor summary of the most important economic data I have added Georg Vrba’s Business Cycle Index, which we have frequently cited in this space. In contrast to the ECRI “black box” approach, Georg provides a full description of the model and the components.
For more information on each source, check here.
Recent Expert Commentary on Recession Odds and Market Trends
Georg Vrba: provides an array of interesting systems. Check out his site for the full story. We especially like his unemployment rate recession indicator, confirming that there is no recession signal. He gets a similar result with the twenty-week forward look from the Business Cycle Indicator, updated weekly and now part of our featured indicators.
Doug Short: Provides an array of important economic updates including the best charts around. One of these is monitoring the ECRI’s business cycle analysis, as his associate Jill Mislinski does in this week’s update. She notes that their interpretation is that the business cycle will not turn higher. His Big Four update is the single best visual update of the indicators used in official recession dating. You can see each element and the aggregate, along with a table of the data. The full article is loaded with charts and analysis.
RecessionAlert: A variety of strong quantitative indicators for both economic and market analysis. While we feature the recession analysis, Dwaine also has a number of interesting systems. These include approaches helpful in both economic and market timing. He has been very accurate in helping people to stay on the right side of the market.
Bob Dieli does a monthly update (subscription required) after the employment report and also a monthly overview analysis. He follows many concurrent indicators to supplement our featured “C Score.”
Bob’s employment report commentary shows plenty of data demonstrating that we remain in a time of economic expansion. He cites various factors showing the impact of structural change. There is no better way to track where we are in the business cycle.
With his customary colorful commentary and wit, Josh Brown recalls the multi-year reasons for skepticism about employment:
And the usual bulls*** from the perpetual doom crowd. With a severe case of mission creep, I might add. The argument against life as we know it continuing keeps changing. If you’re lost track, here’s a chronology:
2009: Unemployment still rising!
2010: It’s all census jobs!
2011: Job growth flattening, double dip recession!
2012: “These Chicago guys!” – it’s all fake numbers!
2013: It’s all part-time jobs and bartenders!
2014: Labor Force Participation Rate is too low!
2015: Not enough wage growth!
2016: There are no manufacturing and mining jobs!
2017: ???
Rest assured, it will always be something, until the next recession. Then the naysayers of 2009, 2010, 2011, 2012, 2013, 2014, 2015 and 2016 will all, in unison, cry out “YOU SEE!”
The Week Ahead
We have a light week for economic data. While I highlight the most important items, you can get an excellent comprehensive listing at Investing.com. You can filter for country, type of report, and other factors.
The “A List” includes the following:
- ISM services (T). Will strength versus manufacturing continue?
- FOMC minutes (W). Theoretically, “old news,” but still watched closely.
- Initial Claims (Th). The best concurrent news on employment trends.
The “B List” includes the following:
- Trade balance (T). Important for Q1 GDP.
- Factory orders (M). Volatile February data with weakness expected.
- Wholesale inventories (F). More volatile February data expected to be weak.
- Crude oil inventories (W). Attracting a lot more attention these days.
There is a super-abundance of FedSpeak — a pundit’s paradise. Especially interesting is a Thursday panel discussion bringing together Yellen and three former Fed chairs for the first time (Greenspan, Bernanke, and Volcker).
How to Use the Weekly Data Updates
In the WTWA series I try to share what I am thinking as I prepare for the coming week. I write each post as if I were speaking directly to one of my clients. Each client is different, so I have six different programs ranging from very conservative bond ladders to very aggressive trading programs. It is not a “one size fits all” approach.
To get the maximum benefit from my updates you need to have a self-assessment of your objectives. Are you most interested in preserving wealth? Or like most of us, do you still need to create wealth? How much risk is right for your temperament and circumstances?
WTWA often suggests a different course of action depending upon your objectives and time frames.
Insight for Traders
We continue both the neutral market forecast, and the bearish lean. Felix is still 100% invested, catching much of the rebound. The more cautious Holmes avoided the downdraft, and during the week increased overall positions to 100% invested. Holmes identifies some good candidates even when the overall market is neutral. For more information about Felix, I have posted a further description — Meet Felix and Oscar. You can sign up for Felix and Oscar’s weekly ratings updates via email to etf at newarc dot com. They appear almost every day at Scutify (follow here). I am trying to figure out a method to share some additional updates from Holmes, our new portfolio watchdog. (You learn more about Holmes by writing to info at newarc dot com.
Are you afraid to “pull the trigger” on your trades? Peter Brandt notes that most experienced traders know what they should be doing but often do not execute. Hint: Don’t chase!
What are your trading principles? Dr. Steenbarger challenges you to write down the top five before making the following observation:
Now take a look at how long it took you to think of and write down those five cardinal trading principles. If it took effort to think of them and took you a while to write them down, then you’ve learned one thing: Your trading principles are not front and center in your mind.
How do you exit from trades? Adam H. Grimes tells you what you need to know about stops. Holmes was barking approval as I read this one, since he uses all of the techniques described.
Insight for Investors
I review the themes here each week and refresh when needed. For investors, as we would expect, the key ideas may stay on the list longer than the updates for traders. Major market declines occur after business cycle peaks, sparked by severely declining earnings. Our methods are focused on limiting this risk. Start with our Tips for Individual Investors and follow the links.
We also have a page (recently updated) summarizing many of the current investor fears. If you read something scary, this is a good place to do some fact checking. Pick a topic and give it a try.
Many individual investors will also appreciate our two new free reports on Managing Risk and Value Investing. (Write to info at newarc dot com).
Other Advice
Here is our collection of great investor advice for this week.
If I had to pick a single most important source for investors to read, it would be Morgan Housel’s latest post on more “things he is sure about.” It is a great list – all worth reading. I especially like this one:
Pessimism always sounds smarter than optimism. That’s because pessimism sounds like someone trying to help you, while optimism sounds like a sales pitch — even if it’s usually right.
And also this:
If we could go back seven years and tell everyone that the Dow is near 18,000, unemployment is 4.9% and gas is $1.90 a gallon, they would think we won the lottery and were drowning in prosperity. Instead, we’re complaining about market volatility.
I was actually pretty close to that time frame with my Dow 20K forecast. Everyone did indeed think I was crazy to suggest anything positive, like unemployment getting below 8%. Most people have been unable to stay the course through the ensuing rally.
Stock Ideas
O'Reilly Automotive Inc (NASDAQ:ORLY) shows the continuing strength in the auto parts market.
KraneShares has a nice analysis of supply-side reforms in China and news from the “two sessions.” For those who are investing in China, this is must-read information. Hint: Shifting away from over-capacity in coal, steel, and real estate.
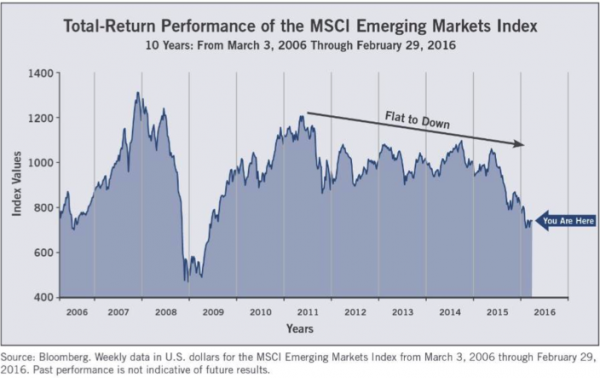
Alliance Bernstein analyzes China and the effects on emerging markets, taking a more bullish posture.
Time for emerging markets? (Wasatch Funds)
Watch out for….
Excessive concentration in your mutual fund. A leading fund bets too big.
The biggest investor mistakes. You would not try to compete with LeBron James at basketball, so why take on Warren Buffett at investing. Isaac Presley explains. I especially agree with his point about taking on too much risk.
Bad pitches. Speaking of Mr. Buffett, a big baseball fan, it is time to remember that you need not swing at every pitch.
Value Investing
“Davidson” (via Todd Sullivan) explains the key point of today’s WTWA: The divergence between markets and fundamentals. He writes:
Fundamental trends drive whether the news will be better or worse than many anticipate. This is why following economic fundamentals which trend at a relative ‘snails pace’ lets long term investors anticipate whether the ‘news’ is going to be better or worse than that anticipated by Momentum Investors. Using economic fundamentals is the Value Investor approach. I anticipate higher market prices because pessimism continues to dominate the news even in the face of decent economic growth.
William Watts asks whether the value stock gains in Q1 can continue, contributing this chart:
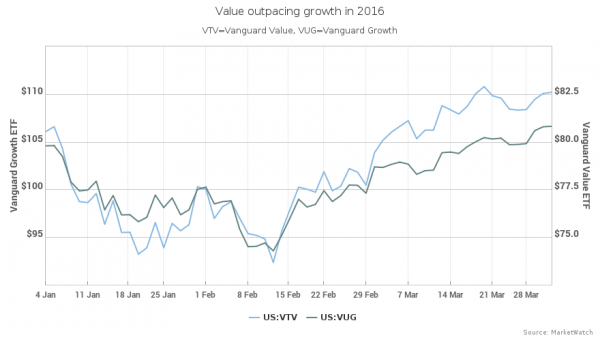
(Those wishing to explore this idea further can get my free report on why 2016 can be the year of the value investor. Request via info at newarc dot com. We never use your email address for any other purpose).
Final Thoughts
What should we make of Yellen’s apparent shift?
Ed Yardeni says, “Thanks Again, Fairy Godmother!” He concludes that she (and dovish colleagues) have less confidence in the economy.
Tim Duy writes that she has decided to “save her legacy” by avoiding deflation at all costs.
Ed Hyman suggestst that the next recession may be five or six years away due to the protracted economic cycle. He writes as follows:
…recessions usually happen around five years after the Fed’s stance on interest rates changes from easing to tightening. Normally, the Fed begins tightening two to three years after a recovery begins. But the depth and longevity of the Great Recession and the slow momentum of the current 65-month recovery kept the Fed from raising interest rates until December of 2015.
Here is what I make of this:
- The current debate over the Fed and the economy could go on for years, not just a few months.
- Many (including politicians of all stripes and parties) gain by emphasizing the negative. It is not just the election, although that provides a focus. News media collaborate.
- The early stages of Fed policy shifts mean little to stock values, despite some knee-jerk reactions.
- The Fed will eventually succeed in stimulating inflation. It always does.
- The eventual reaction to growing inflation will be too late because of the long lags in monetary policy effects.
- These conclusions are all sharply contrarian.
We will eventually enjoy stronger growth and higher wages, closing the gap between perception and reality. It will happen before the next recession and is therefore actionable now.

