After a week loaded with economic data there are plenty of fresh economic worries. In addition, the Fed seems ready to act in spite of some weak data. This means that good news is (finally) good news, and bad news will be bad. For economic and market skeptics, it signals a market shift that they see as long overdue.
Does a market correction loom?
Prior Theme Recap
In my last WTWA I predicted that market observers would be asking whether it was time for an economic spring thaw. That was the right question, with soft data during a busy week leading to a strong initial claims report on Thursday. Friday’s employment report gave a rounding answer – No! – to the spring thaw question. While the stock market was closed, futures trading implies one of those “triple digit” down openings on Monday.
Feel free to join in my exercise in thinking about the upcoming theme. We would all like to know the direction of the market in advance. Good luck with that! Second best is planning what to look for and how to react. That is the purpose of considering possible themes for the week ahead.
This Week’s Theme
The upcoming week reverses last week’s calendar effect.
- The big reports are bunched at the end of one month and the start of the next. We get a very thin serving of fresh data this week.
- It is too soon for the hard news from earnings reports (although we get the unofficial start to the season with Alcoa (NYSE:AA) on Wednesday).
Last week I expected position-squaring in front of Friday’s news, and that seemed to happen. This leaves us with a negative bias for the week ahead (despite Felix’s bullish call – see below).
In the absence of more compelling news, I expect serious discussion about the potential market downside. Look for pundits to be asking:
Is there a correction looming?
The Viewpoints
The viewpoints include those focused on the economy and those more interested in stocks.
- A correction is imminent.
- We are seeing pervasive softening in the economy. The extreme observers think that we are already in a recession and even some mainstream sources have upped the odds to 50%. Nearly everyone agrees that the rate of growth is significantly lower, adjusting forecasts accordingly. Hale Stewart is raising a caution flag.
- A pullback in stocks is long overdue. Traders are reaching out for inverse ETFs (ETF Trends).
- Expect a sideways market. There may be a healthy dip (up to 10%) but it is the entry point many investors have waited for.
- Be a contrarian! Nearly everyone is negative. Some see the results as weather, port work stoppages, and the temporary effects of a stronger dollar. (See employment report links below).
As always, I have my own ideas in today’s conclusion. But first, let us do our regular update of the last week’s news and data. Readers, especially those new to this series, will benefit from reading the background information.
Last Week’s Data
Each week I break down events into good and bad. Often there is “ugly” and on rare occasions something really good. My working definition of “good” has two components:
- The news is market-friendly. Our personal policy preferences are not relevant for this test. And especially – no politics.
- It is better than expectations.
The Good
There was some good news last week.
- Initial jobless claims. 268K was in line with the lowest readings from recent years. The period was not part of the survey for the payroll report, so it is “more recent” news and less subject to revision.
- Auto sales hit a new recent high, as seasonally adjusted annual rate of 17.05 million. (Calculated Risk).
- The trade balance improved nicely, but the gains are deceptive – mostly the result of a rebound after the West Coast port work stoppages. (Diane Swonk).
- The US has a preliminary nuclear deal with Iran. Many will not like the policy, and it is far from a done deal. (See this Brookings post on discrepancies in the Iran domestic presentation). Stocks shrugged, but oil prices declined sharply on the news. The energy reaction seems overdone, but for now we will call this a positive.
- Consumer confidence (via the Conference Board) moved higher and beat expectations. See the analysis and great charts from Doug Short.
- Pending home sales. Growth of 3.1% handily beat expectations. (Calculated Risk).
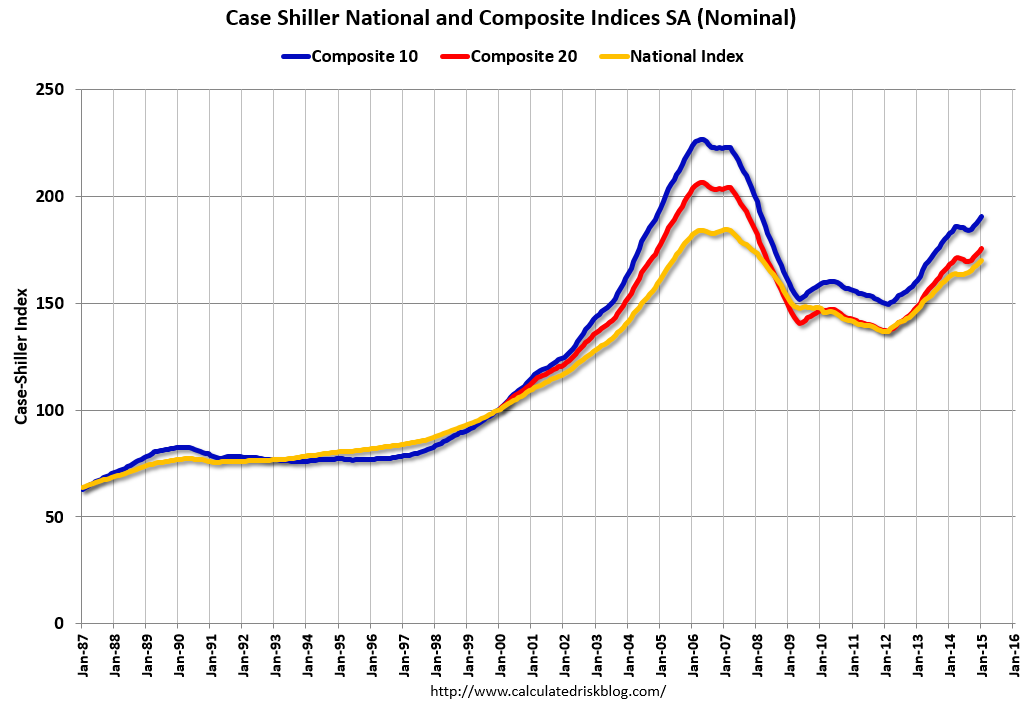
- Home prices. Case-Shiller data from 20 cities continues to show growth in both nominal and real gains. Calculated Risk is the go-to source on all things housing, and this is a helpful chart:
The Bad
There is discouraging news on the most important economic reports.
- Consumer spending lagged, rising only 0.1%, below expectations.
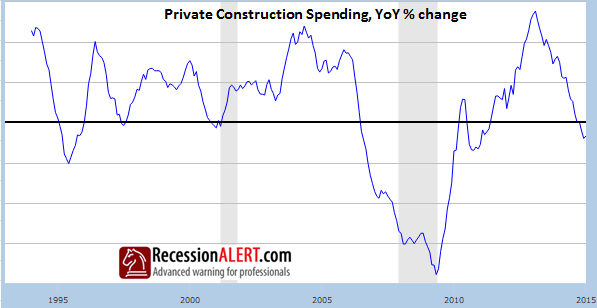
- Construction spending fell, a decline of 0.1%. (See chart in Quant Corner).
- ISM manufacturing missed expectations and continued the recent decline. While the level still signals expansion (51.5) it was a disappointment that left observers wondering when the decline might end. Here is some color commentary from the ISM site:
WHAT RESPONDENTS ARE SAYING …
“Falling energies have helped on the cost side while sales are getting a boost through improvements in consumer disposable income.” (Food, Beverage & Tobacco Products)
“Our business is still strong and on projection. Dollar strength is challenging for our international business.” (Fabricated Metal Products)
“Business is still extremely strong.” (Transportation Equipment)
“Oil prices impacting drilling and project activity. Pursuing cost reductions from suppliers for a wide variety of goods and services.” (Petroleum & Coal Products)
“Business really starting to slow down. Oil pricing is having a major effect on energy markets.” (Computer & Electronic Products)
“Steady Q1 demand but somewhat interrupted by weather.” (Primary Metals)
“Operating costs are higher due to increases in healthcare premiums.” (Miscellaneous Manufacturing)
“March business is improving over Jan-Feb, thawing out of this crazy winter.” (Paper Products)
“Dealing with ongoing delivery issues associated with congestion at the U.S. West Coast and Vancouver ports.” (Machinery)
“Congestion at the West Coast ports delaying incoming products.” (Textile Mills)
- The employment report missed expectations for net payroll employment growth. Despite a few bright spots, observers saw declines in various sectors as a sign of continuing weakness. The stock and bond markets agreed in the limited trading on Friday morning.
- Mainstream take. Diane Swonk: Disappointing headlines and revisions, ongoing threat from expiration of highway funding, small gains in wages, general confirmation of Yellen caution.
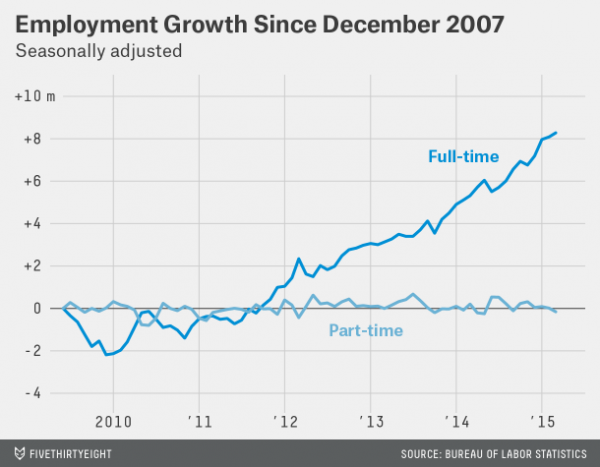
- A mixed picture. FiveThirtyEight: Internals point in different directions. Wages are higher, for example, while hours are lower. Full time jobs (see chart below) are another of the several such points cited in this interesting analysis. (Bob Dieli arrives at several similar conclusions in his monthly update).
- Results overstated. Joe Weisenthal: Compare weather effects to prior years and look at the hardest-hit sectors. The report was not as bad as most think.
The Ugly
Emerging markets. The various central bank moves, currency adjustments, carry trade changes, and revised economic prospects have not been kind to the emerging markets. We have a way of focusing on US policy for collateral damage. Remember when everyone blamed Bernanke for the price of tacos? Here is a thoughtful piece by James Kynge and Jonathan Wheatley of the FT.
Follow up: Chicago finances. (WSJ). “Chicago is Detroit 10 to 15 years from now, if they do not deal seriously with this pension problem,” said Tom Metzold, senior municipal portfolio adviser at Eaton Vance Management, with $28.3 billion of assets under management.
The Silver Bullet
I occasionally give the Silver Bullet award to someone who takes up an unpopular or thankless cause, doing the real work to demonstrate the facts. Think of The Lone Ranger.
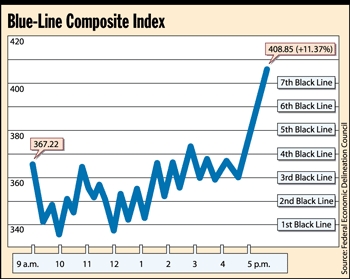
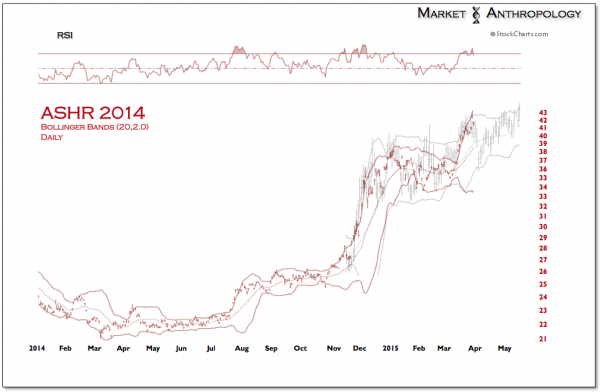
This week’s award (in the spirit of Sidd Finch. (Mentioned because Mrs. OldProf assured me that everyone knew it. If you are not as knowledgeable or old as she, you can visit the link for some great fun). Check out the chart and the award for this excellent technical analysis. (HT – Barry Ritholtz).
Excitement swept the financial world Monday, when a blue line jumped more than 11 percent, passing four black horizontal lines as it rose from 367.22 to 408.85.
It was the biggest single-day gain for a blue line since 1994.
“Even if you extend the blue line’s big white box back many vertical lines, you won’t find a comparably large jump,” said Milton Vogel, a senior analyst with Merrill Lynch. “That line just kept going up, up, up.”
Quant Corner
Whether a trader or an investor, you need to understand risk. I monitor many quantitative reports and highlight the best methods in this weekly update. For more information on each source, check here.
Recent Expert Commentary on Recession Odds and Market Trends
Bob Dieli does a monthly update (subscription required) after the employment report and also a monthly overview analysis. He follows many concurrent indicators to supplement our featured “C Score.”
Doug Short: An update of the regular ECRI analysis with a good history, commentary, detailed analysis and charts. If you are still listening to the ECRI (three years after their recession call), you should be reading this carefully. Doug has the latest interviews as well as discussion. Also see Doug’s Big Four summary of key indicators.
RecessionAlert: A variety of strong quantitative indicators for both economic and market analysis. While we feature the recession analysis, Dwaine also has a number of interesting market indicators. He recently noted an increase in his combined measure of economic stress, although the levels are still not yet worrisome. Recently Dwaine introduced a valuation model that is much more sophisticated than the popular Shiller CAPE method. It also provides a much less worrisome conclusion, 13.7% returns through the end of 2016.
Dwaine is not highlighting an imminent recession, but he takes careful note of some cautionary signs. His most recent update has charts of eight key indicators. Here is one, featuring construction spending.
Georg Vrba: has developed an array of interesting systems. Check out his site for the full story. We especially like his unemployment rate recession indicator, confirming that there is no recession signal (updated chart below). He gets a similar result from the Business Cycle Indicator. Georg continues to develop new tools for market analysis and timing, including a combination of models to do gradual shifting to and from the S&P 500. I am following his results and methods with great interest. You should, too.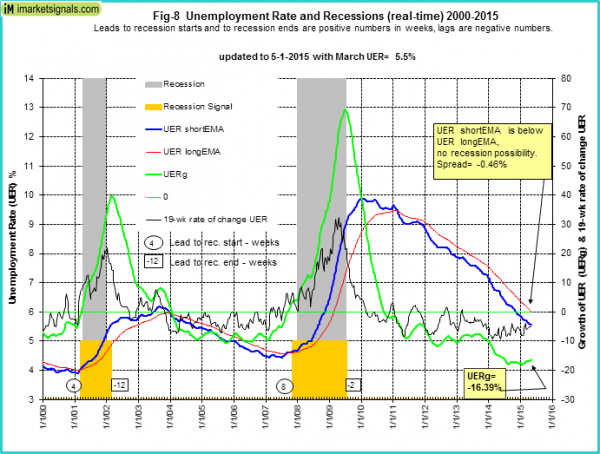
The Week Ahead
It will be a minor week for economic data.
The “A List” includes the following:
- ISM services index (M). Less followed than big brother ISM, but covering more of the economy.
- Initial jobless claims (Th). The best concurrent news on employment trends, with emphasis on job losses.
- FOMC minutes (W). Difficult to believe that there is anything new, but the market parses every Fed nuance.
The “B List” includes the following:
- JOLTs report (M). Not important for job growth or creation (the typical spin) but significant for structural changes.
- Crude oil inventories (W). Maintains recent interest and importance.
- Import and export prices (F). March data with some impact on Q1 GDP.
There is plenty of FedSpeak, the first earnings reports, and the potential for news from Greece and Iran.
How to Use the Weekly Data Updates
In the WTWA series I try to share what I am thinking as I prepare for the coming week. I write each post as if I were speaking directly to one of my clients. Each client is different, so I have five different programs ranging from very conservative bond ladders to very aggressive trading programs. It is not a “one size fits all” approach.
To get the maximum benefit from my updates you need to have a self-assessment of your objectives. Are you most interested in preserving wealth? Or like most of us, do you still need to create wealth? How much risk is right for your temperament and circumstances?
My weekly insights often suggest a different course of action depending upon your objectives and time frames. They also accurately describe what I am doing in the programs I manage.
Insight for Traders
Felix, not having the jobs data in hand, continued a bullish stance for the three-week market forecast. The additional data would probably not change the forecast, but Felix starts with a small handicap. There is still extremely high uncertainty, reflected by the percentage of sectors in the penalty box. Our current position is still fully invested in three leading sectors, mostly because there have been good opportunities in spite of the volatility. For more information, I have posted a further description — Meet Felix and Oscar. You can sign up for Felix’s weekly ratings updates via email to etf at newarc dot com.
Felix did not enter the hedge fund manager contest at Scutify.com ($20,000 in cash and prizes), but he is making a daily appearance to mention a top sector.
Insight for Investors
I review the themes here each week and refresh when needed. For investors, as we would expect, the key ideas may stay on the list longer than the updates for traders. Major market declines occur after business cycle peaks, sparked by severely declining earnings. Our methods are focused on limiting this risk. Start with our Tips for Individual Investors and follow the links.
We also have a new page summarizing many of the current investor fears. If you read something scary, this is a good place to do some fact checking.
Other Advice
Here is our collection of great investor advice for this week:
Featured Commentary
If I were to recommend a single source this week, it would be Gil Weinreich’s article on value investors. He regularly looks at important research findings and writes a clear explanation of the results. This week he highlights an interesting mystery with two parts:
- Value funds beat the markets on a long-term basis:
- Value investors trail the markets.
The reason is that investors in these funds do not remain true to the value concept, accepting that cheap stocks become (and sometimes stay) out of favor for various spells. If you are Warren Buffett, investors have confidence and stay aboard. For everyone else, it is a different story.
So the inconvenient truth is that value investors’ 23-year losing streak indicates they are neither extracting a value premium nor exploiting the mistakes of their counterparties taking the other side of the trade.
Personal Finance
Professional investors and traders have been making Abnormal Returns a daily stop for over ten years. The average investor, even if busy, should join with a weekly trip on Wednesday. Tadas always has first-rate links for investors in this special edition. This week he has a multiple-part interview with Carl Richards about the One Page Financial Plan.
Interpreting Information
Each week Steven Hansen of GEI does a comprehensive economic review with a special focus theme. It is always an interesting read, and a guide to many other articles from the past week. Tucked into this week’s post is a suggestion that your favorite pundit probably falls into one of these categories – and it would be helpful to decide which!
Unfortunately, the talking heads out there may not be giving factual information. There seems to be four kinds of analysts / pundits:
those that are trying to prove a point and ignore evidence to the contrary;
those that are out to make headlines (usually by being negative about most things);
those that are sloppy in investigating and deliver a half baked cake;
those that do not care what the answer is – just want to understand.
You can decide what bracket to put everyone in.
Stock Ideas
Ten stocks with reliable yields – up to 5.7%. (Barron’s)
Chuck Carnevale has an interesting REIT idea. Digital Realty Trust (NYSE:DLR) serves data sites. This is an overall value concept, not the reach for yield that we so often see.
The Shanghai shares have been a good way to play China. (Felix has frequently selected the DB X-trackers Harvest China ETF (NYSE:ASHR), including right now).
Biotech
More on the biotech bubble debate. The complete bull/bear debate via Bloomberg. Did you take Janet Yellen’s advice last year? If so, you missed a big rally.
Methods
Do you invest like Mr. Spock or more like Homer Simpson? Two fund managers who use knowledge from behavioral finance discuss the common errors of most investors and how you can benefit. Take a look at some of their stock ideas. Key method: Watch for negative market reactions despite insider buying.
What to do if you have missed the market rally? (John Coumarianos at MarketWatch) Learn from past selling at the wrong time. Find your correct level of risk and stick with it. (This is actually what I discuss with each new client. Nothing is more important).
Energy and Commodity Stocks
Copper finally seeing a bottom? It is possible with economic stimulus from the Chinese and a weakening in the dollar. Barron’s also notes some supply disruptions.
Hale Stewart argues that Chevron (NYSE:CVX) is attractive and the dividend is safe. His series of posts on individual stocks is well worth following, and easy to do on Seeking Alpha.
Refiners were hit hard on Thursday because the news in Iran narrowed the Brent/WTI spread. I think the algorithmic selling was overdone, especially since the spread has tightened so much (from over $15 to less than $5). Ben Levisohn (Barron’s) has some ideas about why the narrower spreads might not be so worrisome.
Final Thought
In the WTWA series I highlight my expected topic for the coming week, often using a question. I may accurately guess the question, but that does not mean that I have a good answer!
A few readers complain about this, but they are missing the point. Unlike many other observers, I try to stick to what I know. Predicting a market correction right now is a great way to get readers. If you turn out to be right, you can point to anecdotal evidence of your wisdom. Making a 50-50 recession call works, too.
No one has a good, verifiable, real-time track record at predicting small corrections. Meanwhile, many investors get sidelined because they read an article or saw a chart suggesting that “the big one” was right ahead. Some people have been waiting for years for the correction so that they can get back in the stock market. Even when the correction finally comes they will be losers – and that assumes the ability to pull the trigger when things look bad!
I do not know if a correction looms. I do know that a solid, balanced portfolio is possible for each investor. You just need to recognize that there will be some volatility. If your positions are too big, you will react emotionally and unwisely.
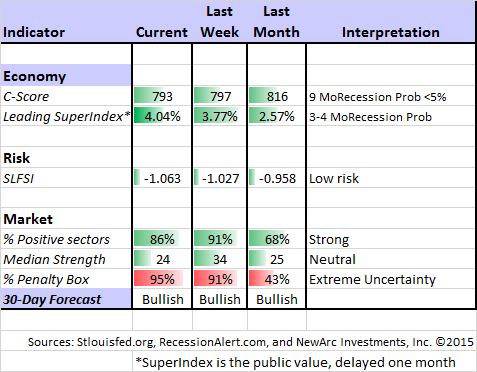
It is important to avoid the really huge sell-offs, all of which have been associated with business cycle peaks (the starting point for “official” recessions) or high levels of financial stress. This is why I worked to discover the best indicators for each, included in WTWA every week. Bullish investors should ask what might change their minds. Increased risk is one such factor.
For the moment, these dependable risk indicators are reassuring. This is still a good time to establish a balanced portfolio.

