Bravo Zulu to the people of Great Britain for deciding to kick those worthless EU bureaucrats out of their lives. Though from what I’ve read, it seems Scotland in the main voted to stay in the EU. I’m not surprised. Since the 13th century, with King Edward I, a.k.a. “Hammer of the Scots”, Scotland had attachments to the continent the English have lacked. Well the best to both people; each having richly endowed the world in knowledge and culture for centuries. As an American of Irish decent, I’m grateful for the British traditions (English and Scot) I’ve inherited. I say this knowing I’ll get some feedback from my fellow Americans, those who still long for the good old days of the Bolshevik Revolution.
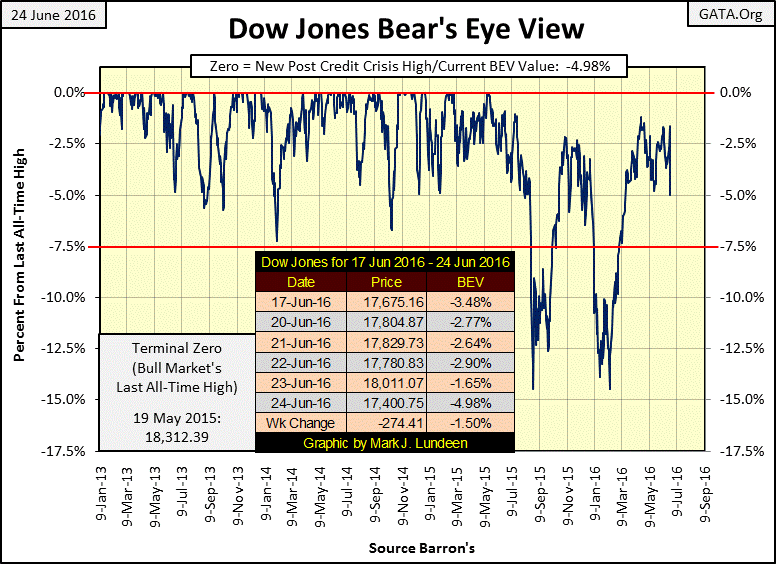
But what about the Dow Jones? What a difference a simple Brexit can make! One day it’s just 1.65% from making a new all-time high, the next day the Dow Jones finds itself just a whisker from breaking below its BEV -5% line.
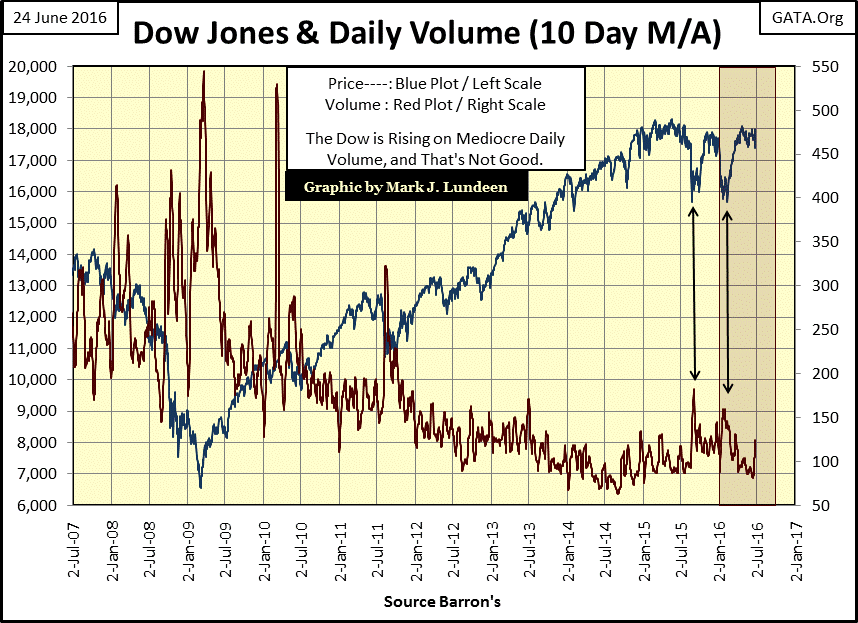
And as I expected, this decline in the Dow Jones once again occurred with an expansion of trading volume. A sure indication the “policy makers” (America’s worthless bureaucrats), had “injected liquidity” into the NYSE and NASDAQ to “stabilize market valuations.” Should the Dow Jones continue to decline, count on seeing a corresponding increase in trading volume.
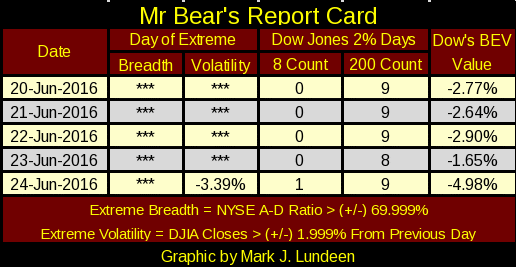
Mr Bear was a bad bear this week. As you see below, his report card has an extreme day of volatility, a day where the Dow Jones saw a percentage move of +/- 2% (or more) from a previous day’s close. We haven’t seen one of these since March 1st when the Dow Jones was up 2.11% from the previous day. However, this week Mr Bear failed to produce a day of extreme market breadth (NYSE net A-D Ratio> 70%), and he had not done so since January 29th. With the Dow Jones down a big 3.39% on Friday, I’m surprised we didn’t see extreme days in both volatility and breadth. But I can report that on both Thursday, when the markets were celebrating the anticipated failure of the Brexit, and again on Friday when the markets were shocked at being wrong, the NYSE came very close to realizing a NYSE A-D 70% day.
Thursday: +64.03%
Friday ----: -66.84%
The thing to do now is to wait and see what next week brings. If things behind the scenes are as bad as I expect them to be, I’ll again be sending home Mr Bear with even worse report cards. But that presupposes the failure of the FOMC to “stabilize current market valuations.” I’ll believe that when I see it; maybe next week.
The banking system is currently leveraged to levels past generations would have thought not only impossible, but to levels rational people would have rejected out of motives of pure personal self-preservation. The entire global banking system is hogtied to the multi hundred-trillion dollar OTC derivative market; a market where the consequences of an unanticipated 3% move in stocks or bonds is levered many times.
How much of a percentage decline in the stock market, an advance in the price of gold or silver, or a percentage increase in bond yields would it take to drive our too-big-to-fail banking system into receivership? I haven’t a clue, but I fear we’ll all find out before the November elections.
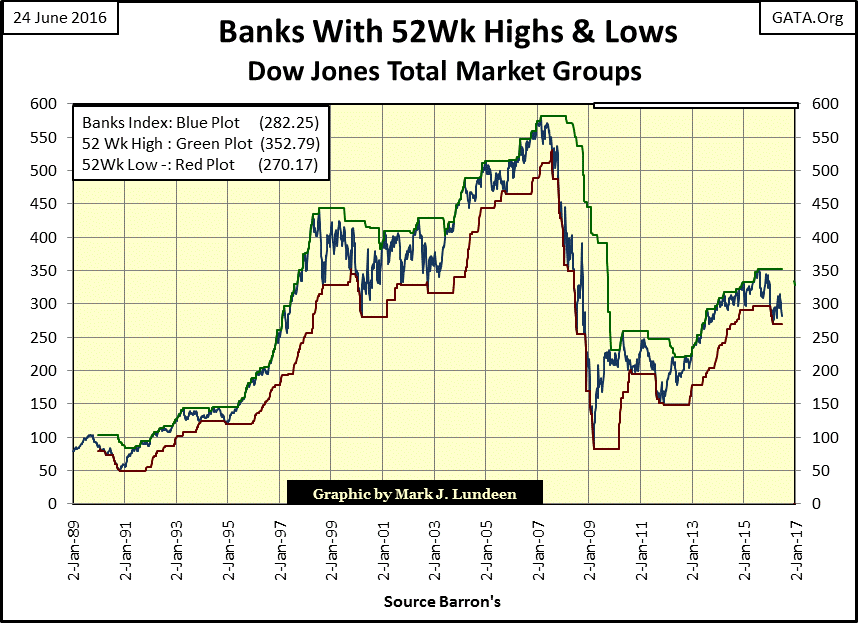
As it stands at the end of the week, the DJTMG’s Banking Index is only twelve points from making a new 52Wk low. The success of the Brexit caught many leveraged players on the wrong side of history. We’ll not see the full extent of this week’s damage until the next few weeks are in the market’s rear view mirror. Currently, the banks’ 52Wk low is 270.17. Should the DJTMG’s Banking Index break decisively below that level in the following month, it will be a harbinger of things to come.
When most people think in terms of bull and bear markets, they think of the Dow Jones or the S&P 500. I admit that I do too, and why not? But the Dow Jones Total Market Groups (DJTMG) is a powerful market tool that examines the stock market in its entirety. Let’s spend some time this week tolearn what its expectation of the stock marketis.
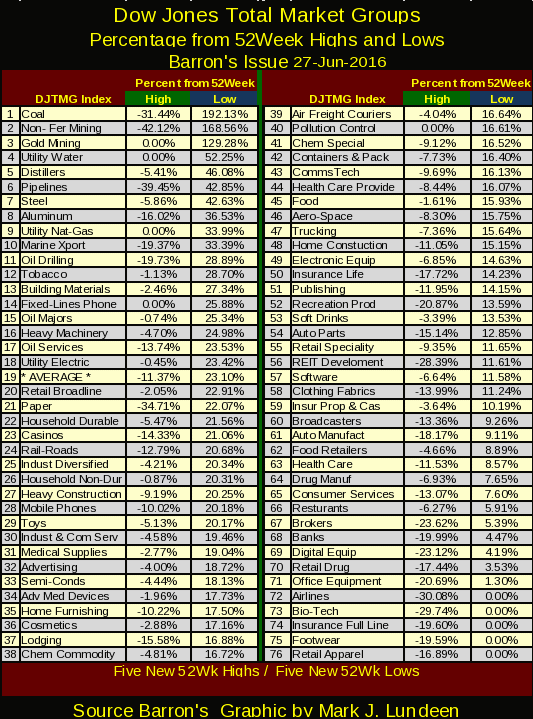
Here’s the DJTMG’s 52Wk High and Low table. Unlike the banks (#68) the gold miners (#3) at week’s end found themselves on the right side of history, earning them a new 52Wk High at the close of Friday’s trading.
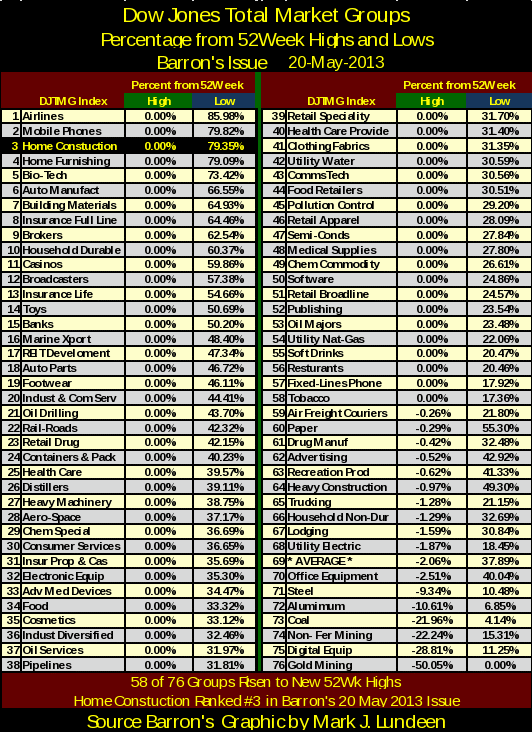
What a difference from three years ago, when today’s top three groups were competing for the bottom of the pack. As you can see below, the gold miners took bottom honors. Also in Barron’s 20 May 2013 issue, fifty eight of the seventy six groups made a new 52Wk High. Viewing the market from the perspective of 52Wk Highs and Lows, that was the DJTMG’s market top from the March 2009 lows of the credit crisis. After May 2013, no matter how well the Dow Jones or the S&P 500 did, finding individual stocks, even those included in the advancing market indexes that produced capital gains, became increasingly difficult.
Note: the data above was sorted by the Blue 52Wk Low column, while below it was sorted on the Green 52Wk High column. Still the difference is apparent; today the stock market just doesn’t have the same enthusiasm it had three years ago. However, there are exceptions to this. Three years ago (below), the #1 group was the Airliners. In this hot market the Airliners were 85.98% above its 52Wk Low. Then today’s top three groups (above table) all find themselves comfortably above 100% from their 52Wk Lows.
Remarkably, it was just six months ago in January, when this week’s #1,2& 3 groups in the rankings made their last 52Wk Low, and ranked as follows in the table:
Gold Miners -----: #70
Non-Fer Mining: #75
Coal ----------------: #76
Seeing the miners of precious metals doing so well in trying times, as their precious banking stocks struggle, has to be a major concern of the “policy makers”, as it’s the stock market’s vote of no confidence in their “policy”.
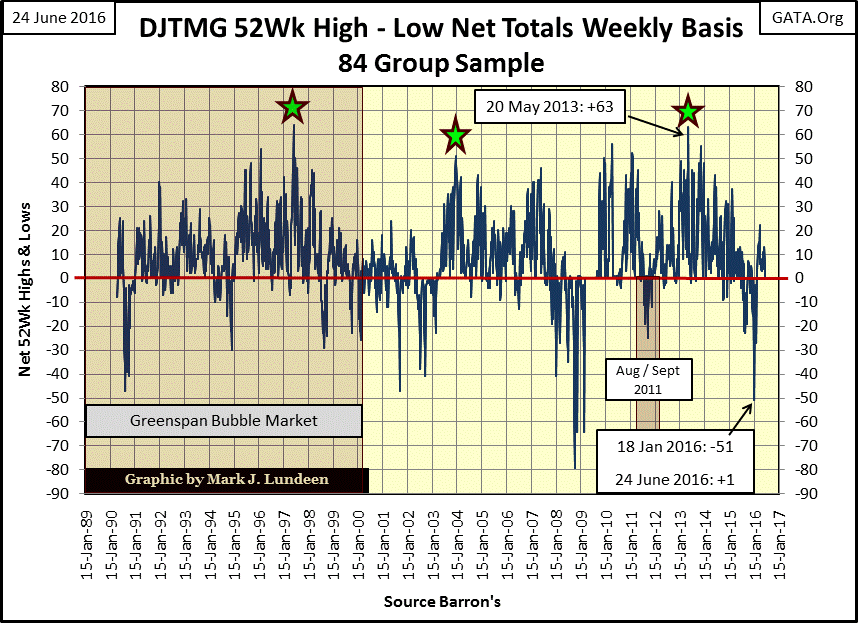
Below, I’ve plotted the DJTMG’s 52Wk High – Low Net Totals from 1990 to this week. FYI, the data above contains only the individual groups (76), while the chart below also includes the major groupings such as materials, finance, healthcare,etc (84), so the sample sizes are not identical.
Note how DJTMG’s 52Wk highs peaked two years before the beginning of the high-tech bear market. 52Wk highs peaked three years before the beginning of the credit crisis market crash, though they rebounded in the first half of 2007. In our post credit crisis market advance, DJTMG 52Wk Highs peaked in Barron’s 20 May 2013 issue (see table above), butover the past three years, fewer groups have found the strength to do so. This is a classic pattern of increasing market weakness that has preceded every major market decline of the past twenty-five years.
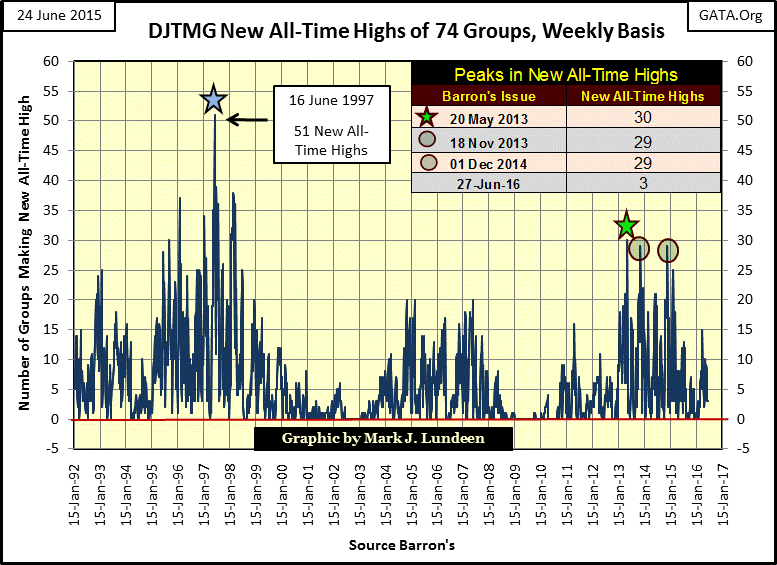
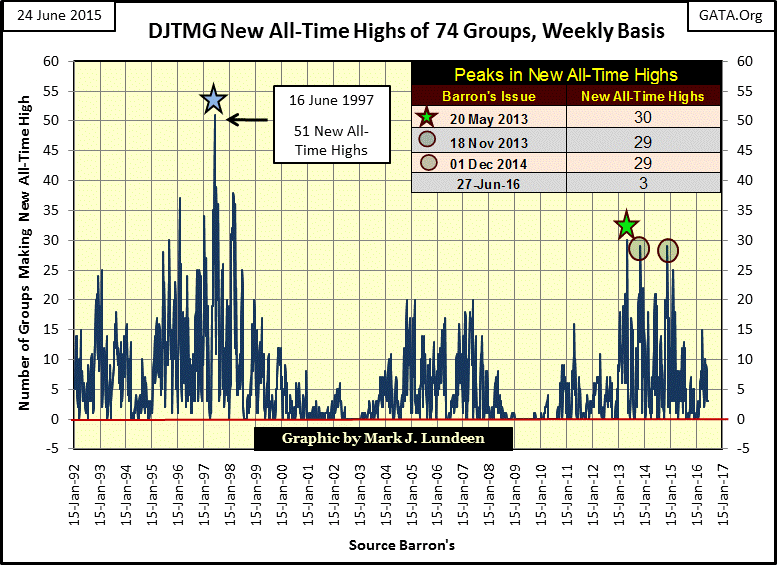
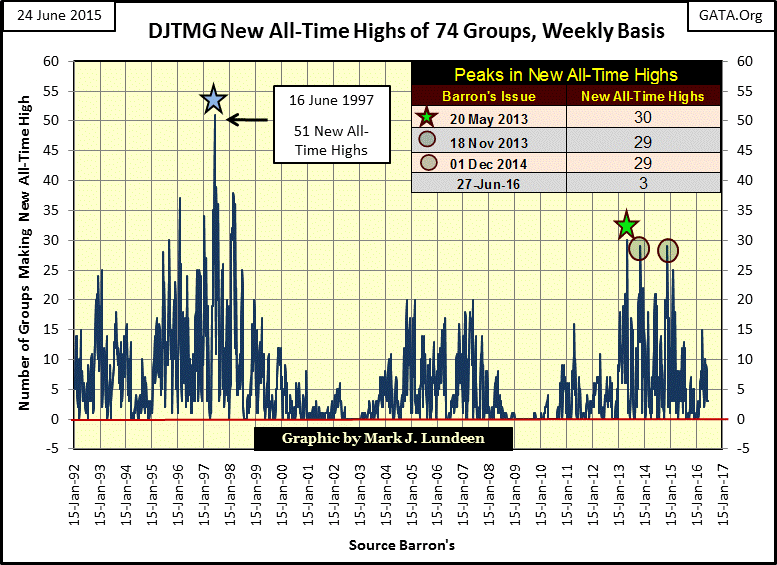
Looking at new all-time highs in the DJTMG (below), the same topping pattern that occurred previous to the high-tech and credit-crisis bear markets is clearly evident in the market today. Except, I would say that the current topping pattern is problematic. Would we’ve seen so many new all-time highs in the post March 2009 advance had the Federal Reserve not “injected” the financial markets with three doses of QE? Or had corporate America’s managementnot weighed down their companies’ financial positions with untold trillions of dollars of debt to finance their self-serving share buy-back programs? I’m sure it wouldn’t have.
When the “policy makers” yet again lose their grip on the market’s valuations, as they did in 2000 and again in 2007, expect something historic happening to the downside.
Below, the DJTMG’s Top 20; the number of groups within 20% of their last all-time high is also contracting. The Top 20 Peaked in Barron’s 07 July 2014 issue at 52 groups, and ended this week at 37. What I find so useful about this DJTMG data series, as opposed to its Net 52Wk High – Lows, or the number of new all-time highs seen in the charts above, is how the Top 20 is almost like a moving average, lacking the clutter seen above. With rare exception, it moves purposefully upward from bear market bottom to bull market top, then downward from bull market top to bear market bottom. It’s significant that for the past two years, the DJTMG has continued seeing fewer and fewer of its groups within 20% of their last all-time high.
Note below how many groups were within 20% of their last all-time high during the last half of 1990s. In Barron’s 04 August 1997 issue, it peaked at 71 of 74 groups were within 20% of their last all-time high. No wonder everyone loved Alan Greenspan! I spent a year in Singapore in the 1990s. I was surprised at how many Singaporeans knew and respected our Rock-Star Fed Chairman.Greenspan’s “liquidity” was even flowing overseas.
The red star denotes the December 1996 speech Greenspan made on “Irrational Enthusiasm”, where he asked the question; how can we know when there is a bubble being blown in market valuations? I would say that when 70 of the 74 groups in the DJTMG are within 20% of their last all-time high, reasonable people can be sure that something was amiss.
The high-tech bear market bottomed with the Top 20 at 6. At the bottom of the credit crisis bear there were NO GROUPS WITHIN 20% OF THEIR LAST ALL-TIME HIGHS. The Top 20 is once again headed down; where it and the Dow Jones and S&P 500 will bottom is the big question.
Considering all of we see above, Brexit or not, this seven year market advance is due for a significant correction, or even a significant BEAR MARKET. If the “policy makers” today are willing to bid for stocks at prices no one else is offering to “stabilize current market values”, I say this is the time to sell a significant position of what you may have in the general market, and go buy some gold, silver and maybe some precious metal miners.
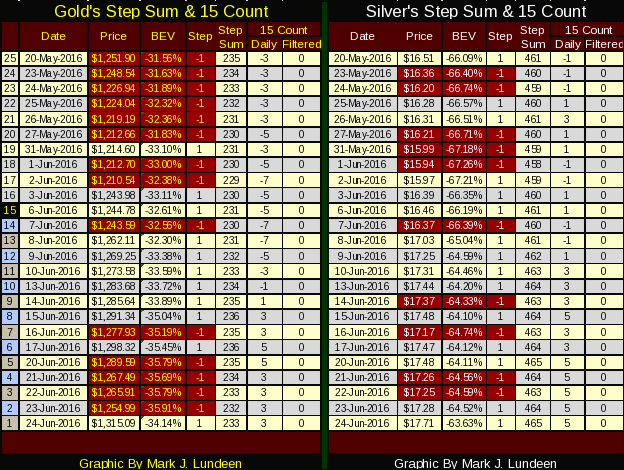
With the realization of the Brexit becoming a reality, the “policy makers” received a real hammering in the gold market this Friday. In gold’s step sum chart below, we see the price of gold and its step sum declining from last Friday to Thursday of this week. Then for a change, on Friday it was the bad guys who got bushwhacked. Overnight in Hong Kong, gold saw $1360 on the Kitco site. If not for the market chicanery the “policy makers” are famous for in the gold market, gold could have closed the week close to $1400 in New York.
Gold and silver’s step sum and 15 count tables below tell the tale better than I can. The big banks were really going after gold all week long. But then came Friday, where gold closed above $1300 for the first time since 22 January 2015 – ouch!
But what’s with silver? After all those up-days the gold market failed to see, silver should have closed comfortably above $18 this week. I can’t see into our uncertain future with more clarity than the all-knowing Wizard of Oz could. But when whatever is holding back the advance in silver loses its grip, I expect to see something spectacular happen in the silver market.
With the big banks so exposed to the short side of the COMEX gold market (chart below), they had to contain the damage to their banking system by getting the price of gold down. I don’t know what the net short position of the banking system is, but those 569,506 open contracts represent 56.95 million ounces of gold exposure to the shorts. Had the COMEX market closed on Friday at the Hong Kong price of $1360, an increase of $105 from Thursday’s close, that would have been a $5.97 billion loss for the shorts. As it worked out, the shorts’ losses were managed down to only $3.42 billion.
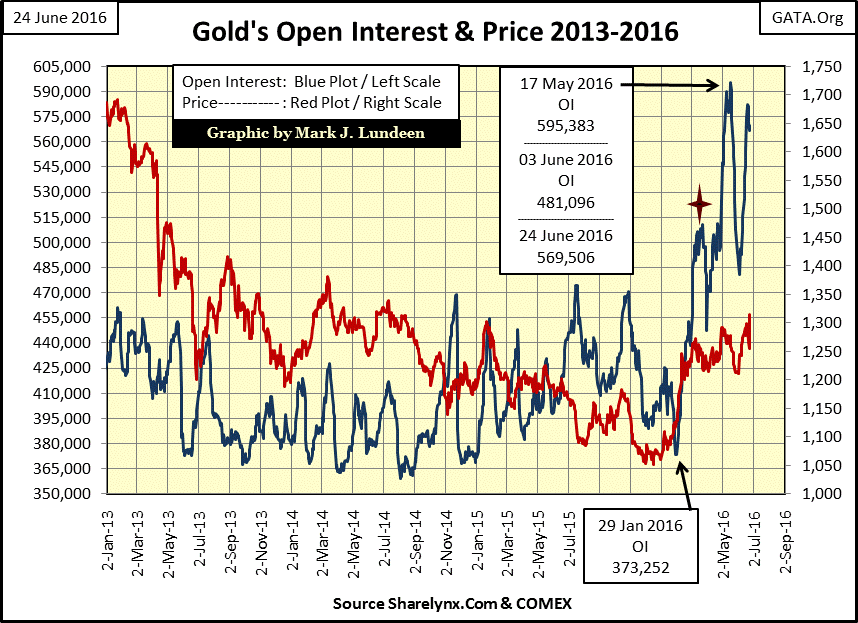
Even so, the sharks in the water are smelling blood. If a hedge fund operating in New York or London were to demand a large delivery on the COMEX’s August contract, which currently has over 400,000 contracts open, they’d be sure to receive phone calls from the halls-of-power making them an offer they couldn’t refuse to persuade them not to.
The Obama Administration has unnecessarily vexed many countries in the past seven years, which would love to return the favor. For Russia, China, or even Saudi Arabia or Iran, to buy those contracts and demand delivery might very well do the trick.
