It has been a couple of weeks since I’ve written a Technical Market Outlook, so it’s good to get back to updating these charts again. Last week the S&P 500 (SPX) finished 0.22% higher, the Russell 2000 (via iShares Russell 2000 Index (ARCA:IWM)) ended the week down 0.15%, and Emerging Markets (via iShares MSCI Emerging Markets ETF (ARCA:EEM)) had a strong finish, closing out on Friday up 1.75%.
Trend
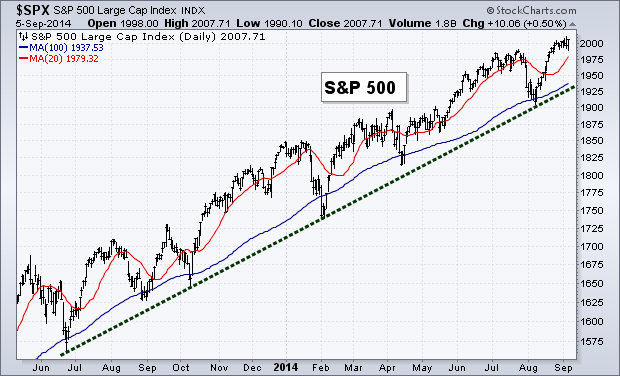
As the S&P 500 continues to head higher and hit new highs, the trend is of course still positive. We remain above both the 20-day and 100-day Moving Averages as well as the long-term trend line.
Momentum
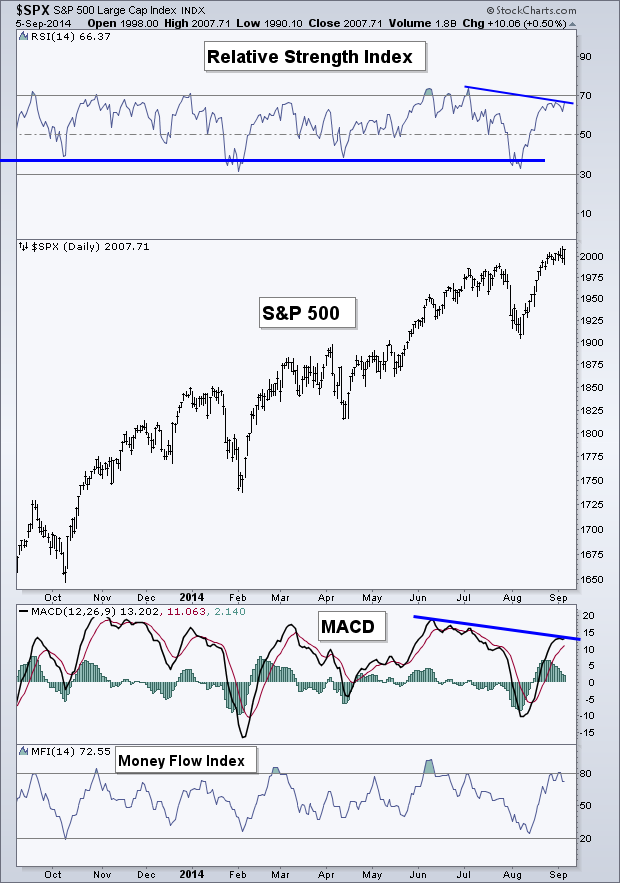
As the equity market has been strong over the last couple of weeks, we have seen momentum apparently hit some headwinds. A small divergence has developed in the Relative Strength Index as well as the MACD indicators on the daily time frame. While the momentum indicators have not begun turning lower, they have also not confirmed the new highs seen in price.
Treasury Yield
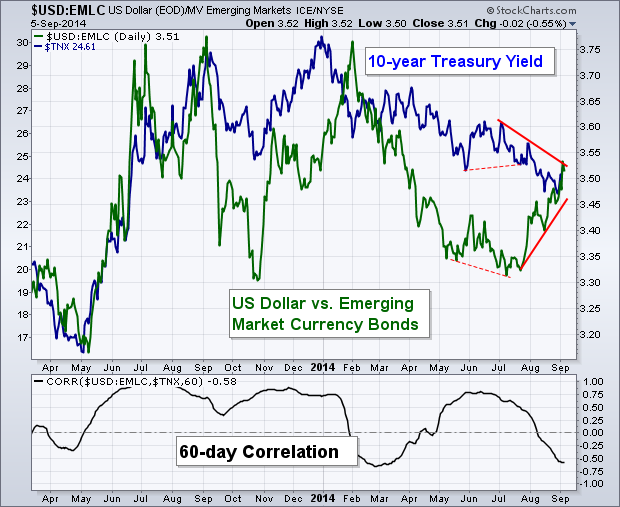
On July 10th I tweeted the below chart showing the divergence that was taking place between the 10-Year Treasury Yield and the ratio between the U.S. dollar and Emerging Market Currency Bonds. Jeff Gundlach once said that he watches the relationship between the U.S. dollar and emerging markets as a leading indicator for the direction of U.S. Treasury yields. Back in July the ratio between the Dollar and Currency Bonds was heading lower, which was ultimately followed by the continued drop in the 10-year Yield too.
Now we are seeing the correlation between the 10-year Yield (TNX) and the ratio once again breaking down as the dollar strengthens against Emerging Market Currency Bonds with TNX not responding in kind. While the 10-Year Treasury Yield has found support at the 100-day Moving Average, I’ll be watching to see if it begins to react to the rise in the dollar against emerging market currencies or if this divergence becomes more severe.
Breadth
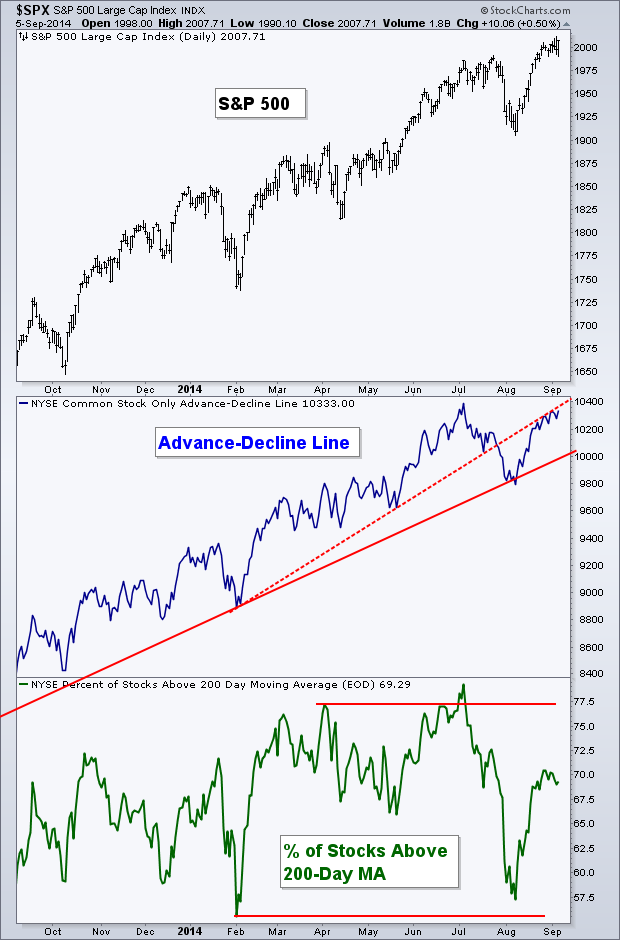
Like momentum, we have a slight divergence in the NYSE Common Stock-Only Advance-Decline Line, which has yet to take out its previous high. However, I will note that the S&P 500 (via the SPDR S&P 500 ETF (ARCA:SPY)) Advance-Decline Line (not shown) has confirmed the new high. We are also not seeing much strength in the Percentage of Stocks Above Their 200-Day Moving Averages, as the indicator remains under 70%.
60-Minute S&P 500
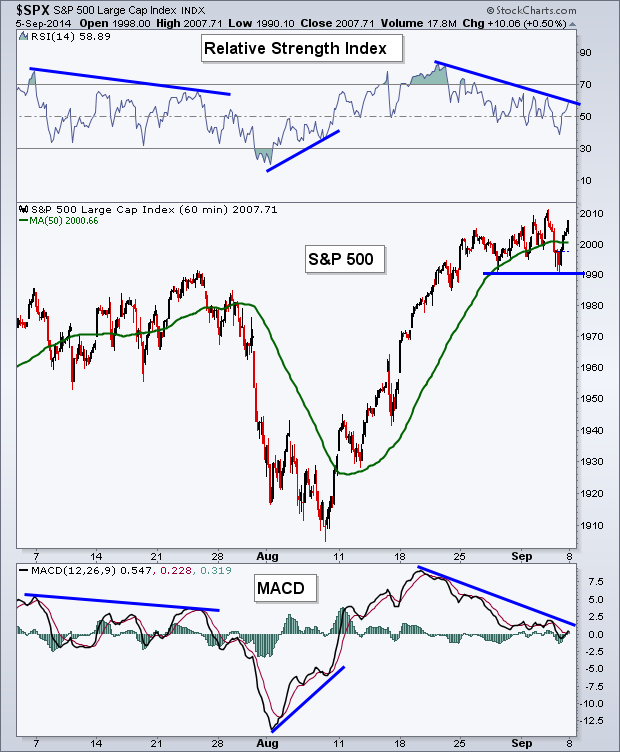
Looking at the intraday price action of the S&P 500 (SPX), the strength in price does not appear to be being confirmed in the RSI or MACD momentum indicators. We last saw an example of this in late July which led to price dropping a couple of percentage points and eventually creating a bullish divergence in momentum and sending price right back and to a new high. 1990 has acted as support recently, so that’s the level I’ll be watching if price does weaken this week. If we can’t hold on to that then price may see some more selling.
Small Caps
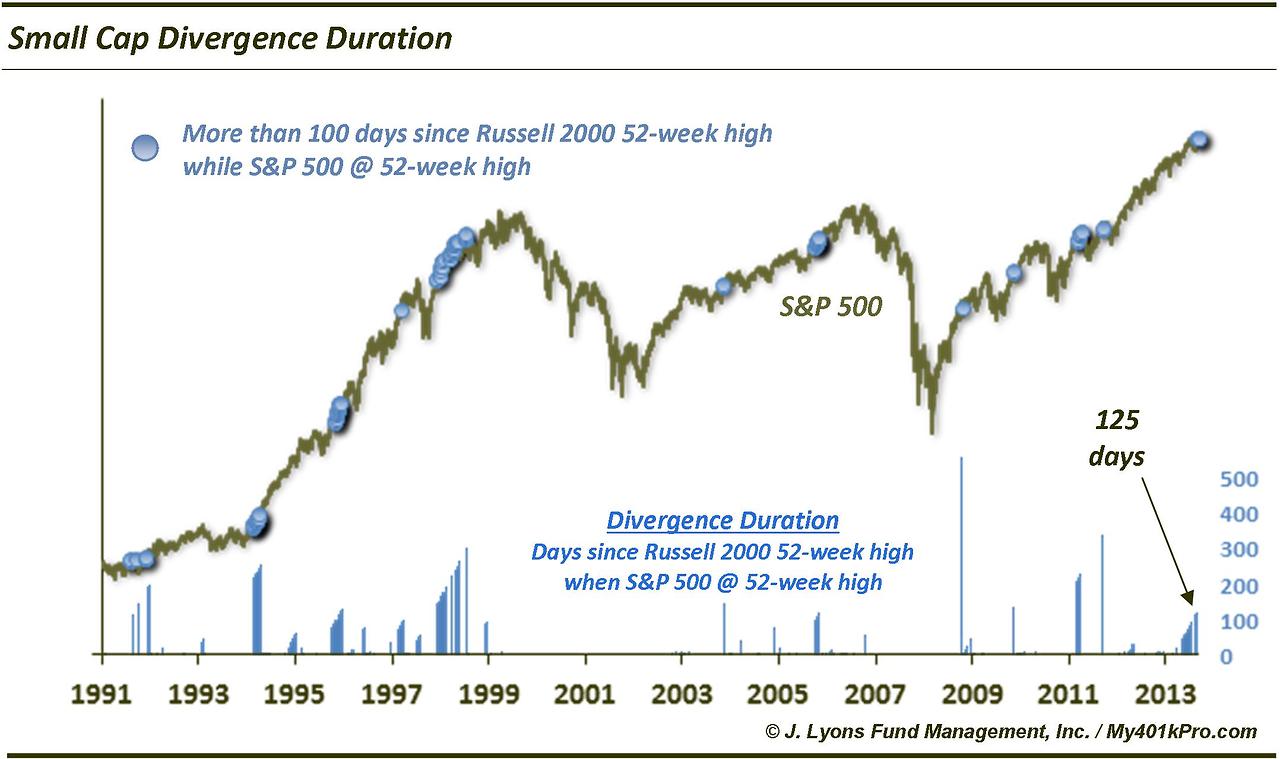
Dana Lyons has become one of my favorite follows on Twitter and Tumblr. Dana produces some really interesting research and is someone definitely worth a follow. Last week, Dana wrote an interesting post looking at the duration of the divergence between small and large cap indices.
While this topic of lack of confirmation in small caps has gotten discussed quite a bit this year, the length of time of the divergence, based on the work done by Lyons’, actually doesn’t lend itself to a complete bearish argument. Dana writes that:
“[The] Long-duration S&P 500-Russell 2000 divergences have not led to the calamitous types of events one often hears warnings about. 10 of the 11 such historical precedents have led to only moderate hiccups in the market. The two most similar to our present divergence, however, have had split results, including a bear market.”
The chart below shows theexamples of previous 100+ day divergences between small and large caps while the large caps were making new 52-week highs.
Last Week's Sector Performance
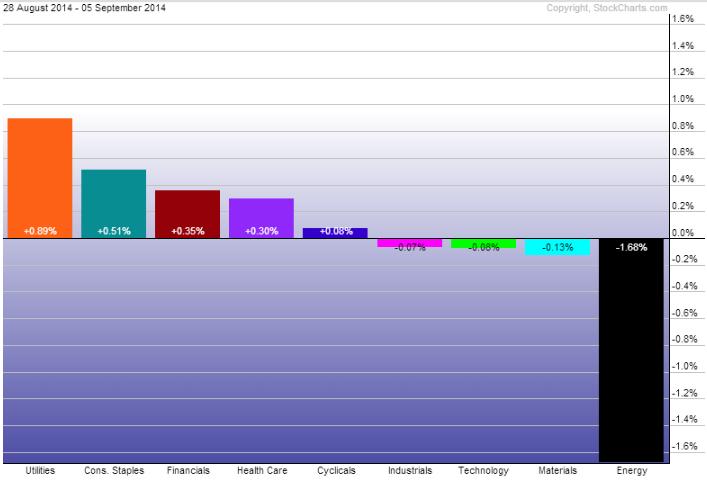
Once again, Utilities (SPDR Select Sector - Utilities (NYSE:XLU)) led the way last week, followed by Consumer Staples (SPDR - Consumer Staples (ARCA:XLP)) and Financials (Financial Select Sector SPDR Fund (ARCA:XLF)). The Energy sector (SPDR Energy Select Sector Fund (ARCA:XLE)) was the big under-performer for the week, followed by Materials (SPDR Materials Select Sector (ARCA:XLB)) and Technology (SPDR Select Sector - Technology (NYSE:XLK)).
Sector Performance Year-to-Date
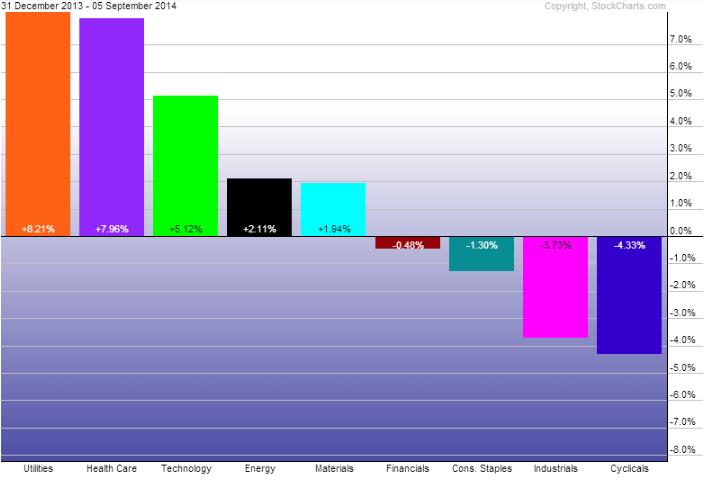
While Utilities had faulted a couple of weeks ago, it has moved back to being the best performing sector YTD as it just barely beats out Health Care (SPDR - Health Care (ARCA:XLV)). Consumer Discretionary (SPDR Consumer Discr. Select Sector (ARCA:XLY)) and Industrials (Industrial Sector SPDR Trust (ARCA:XLI)) round out the bottom of the pack.
Disclaimer: Do not construe anything written in this post or this blog in its entirety as a recommendation, research, or an offer to buy or sell any securities. Everything in this post is meant for educational and entertainment purposes only. I or my affiliates may hold positions in securities mentioned in the blog. Please see my Disclosure page for full disclaimer.
