Dollar ended the week as one of the weakest major currencies after Fed signaled that even if the first hike could still come in September, the following tightening path would remain gradual. The greenback was only overwhelmed by the New Zealand dollar as analysts saw the much weaker than expected Q1 GDP reading as sealing the case for a July RBNZ cut. Sterling was the strongest major currencies as boosted by strong inflation and wage growth data. Meanwhile, euro stayed resilient in spite of the endless Greece drama, which is now entering the final stage. Volatility was seen in other financial markets but they're generally staying in range. DJIA rebounded but was stuck in recent range below 18351.36. Similar picture was found in S&P 500 which failed to break out from range from 2134.72 high. Crude oil extended range trading below 62.58. Gold was back above 1200 handle.
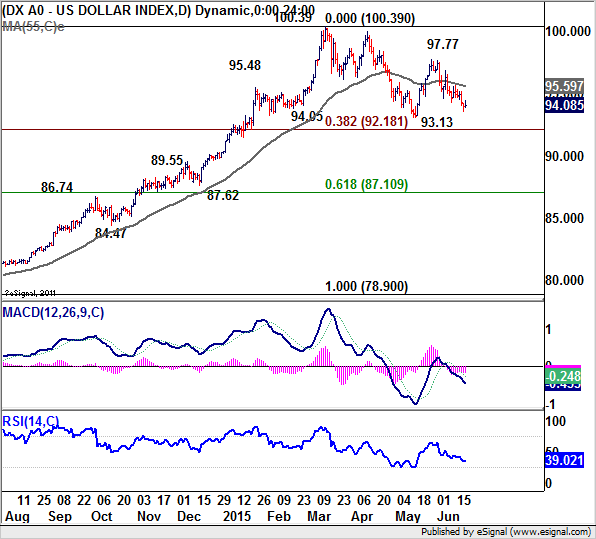
Dollar index's fall from 97.77 extended last week and that wasn't a surprise to us. The fall from 97.77 should be part of the consolidation pattern from 100.39 and deeper fall would be seen to 93.13 support and below. At this point, we'd expect 38.2% retracement of 78.90 to 100.39 at 92.18 to hold to bring up trend resumption eventually. Hence, we'd likely see more weakness in dollar index in near term before the up trend resumes finally at a latter stage.

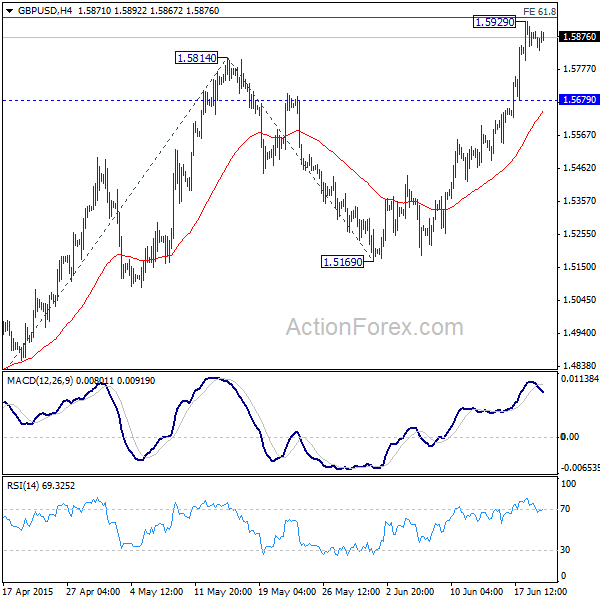
While sterling was strong last week, we'd be a bit skeptical on the sustainability of its strength. GBP/USD's rise from 1.4565 resumed last week by taking out 1.5814 resistance. The pair will first face resistance from 61.8% projection of 1.4565 to 1.5814 from 1.5169 at 1.5941. Next will be 61.8% retracement of 1.7190 to 1.4565 at 1.6187. Strong resistance could be seen between 1.5941/6187.

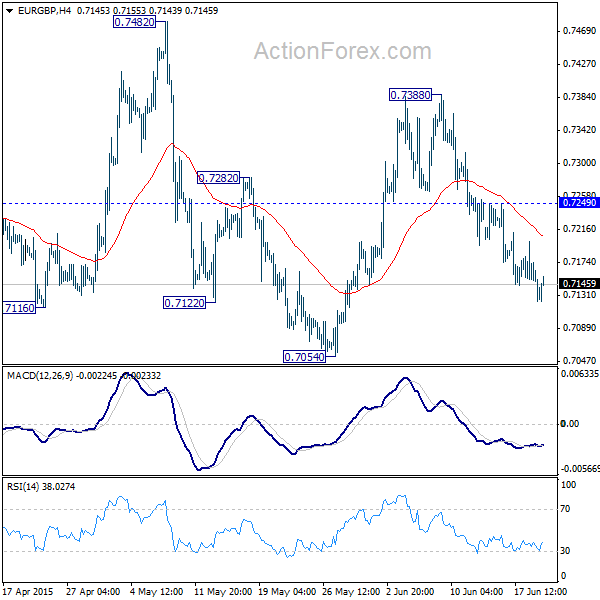
EUR/GBP is seen as trading in sideway consolidation from 0.7013. A test on 0.7054 support could be seen. but there is risk of strong support between 0.7013/7054 to bring rebound to extend the sideway pattern.

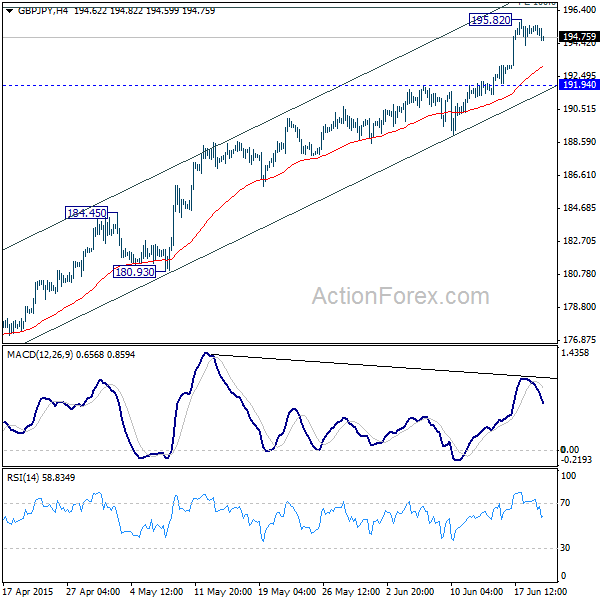
GBP/JPY's up trend is on course for 100% projection of 168.01 to 189.70 from 174.86 at 196.55. However, there could be strong resistance at the next cluster level around 200, which include 61.8% retracement of 251.09 to 116.83 at 199.80.

Thus, while more upside would be seen in sterling in near term, we'd be suggest not to long sterling or medium term trades.
Regarding trading strategies, our AUD/USD short looked shaky again as the pair recovered to as high as 0.7848, just below our stop of 0.7850. We'll hold on to AUD/USD short for the moment with the same stop. Again, we'll looking at larger down trend resumption through 0.7532 low. But another strong rally in the pair will delay the case and extend the medium term sideway pattern from 0.7625 with another rise. On the other hand, EUR/AUD continued its sideway trading last week. And we'll hold on to the long position with stop at 1.4300. We'll continue to stay away from new positions for another week and wait for an opportunity to buy dollar later.
