Last week ended with extremes in equities, Treasuries and volatility. That combination, together with positives in seasonality, were the primary catalysts for a positive week in the markets (post). But the gains this past week were well beyond anyone's expectations. From their lows, SPX, DJIA and NDX all rose 5%. In Europe, the DAX and FTSE each rose 6%.
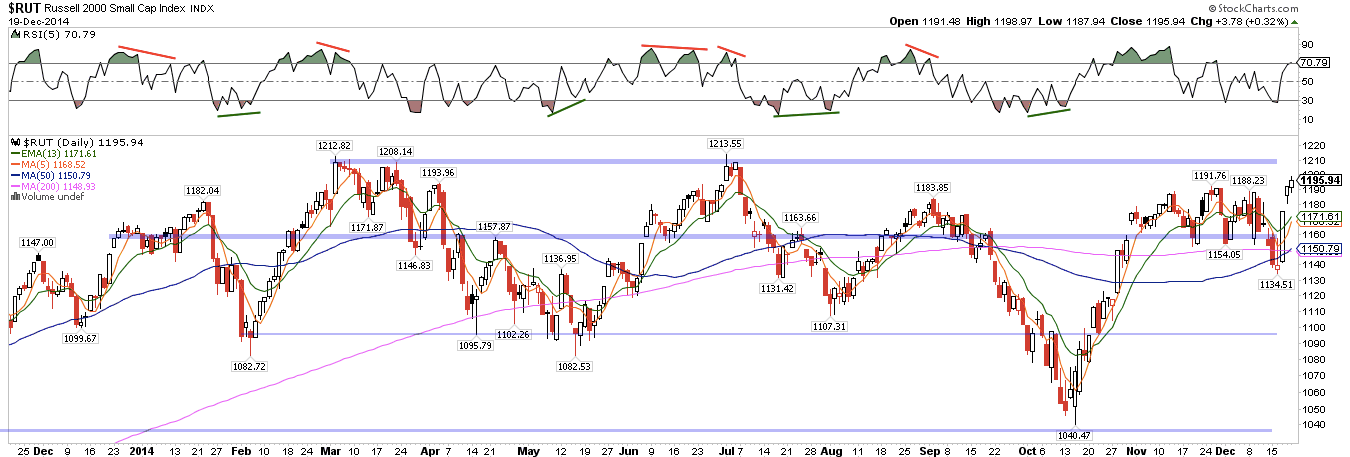
The RUT, which had been the weakest index in the US, closed at its highest level since early July. It is less than 1% from making a new ATH. The glass half-full view is that 2014 was a year of consolidation. It remains rangebound until it clears the March/July tops.
The other three indices in the US are about 1% below their early December highs. Their lows this past week look like a backtest of the breakout from their September highs. These indices are also, once again, approaching the trend line tops from the beginning of 2014. Those trend lines have provided resistance all year and will, we suspect, do so again.
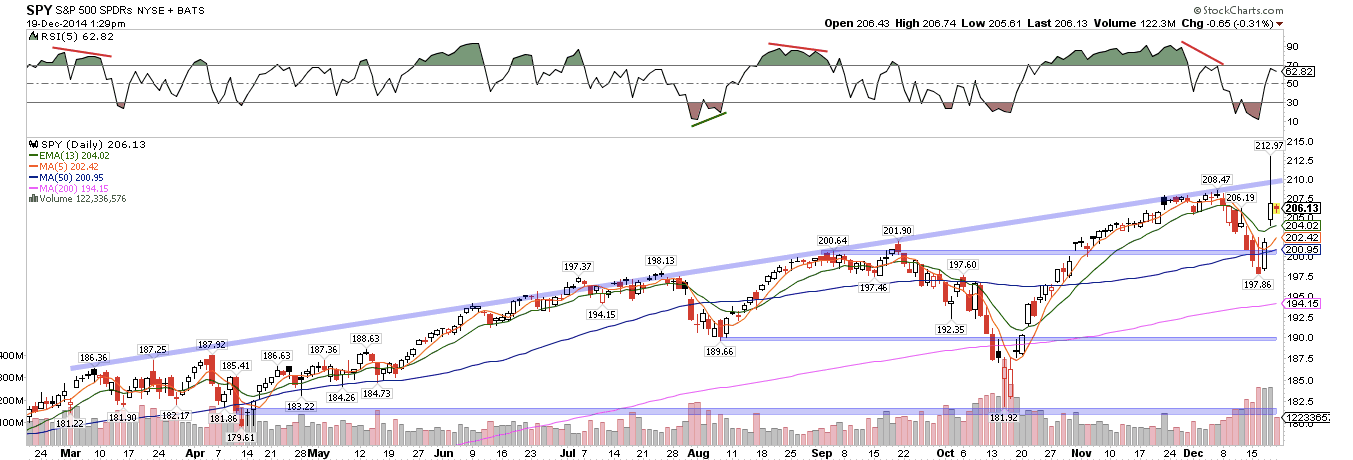
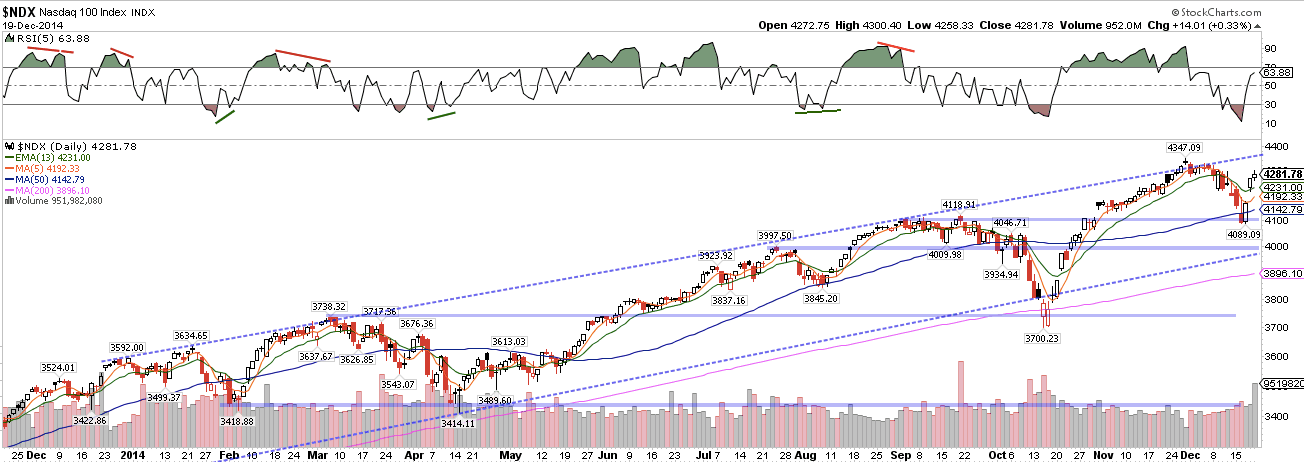
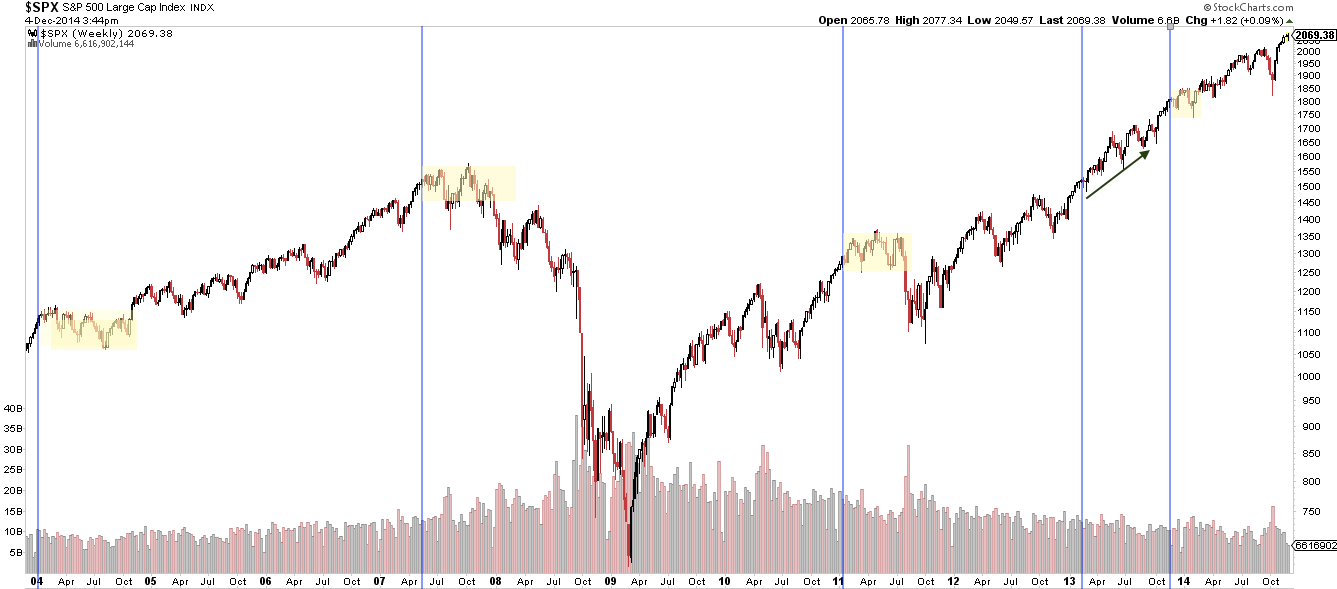
If the trend line tops are in fact resistance, then there is limited upside from here (about another 2%). That would fit the pattern we have discussed in recent weeks where a streak of 7 up weeks in a row always results in at least one higher high but also, most often, limited upside over the next several weeks or longer. As a reminder, the chart below shows the most recent times SPX was up 7 weeks in a row.
There were two notable aspects to this past week's rally.
The first is that upside volume was both high as well as lopsided: on Wednesday, advancing volume was 17 times greater than declining volume. This is a 'major accumulation day' (MAD) and indicates very strong buying interest. In the past two years, the only other MADs were at the SPX lows in January 2013 and October 2013. Both of these initiated long moves higher in SPX (read a post on this here).
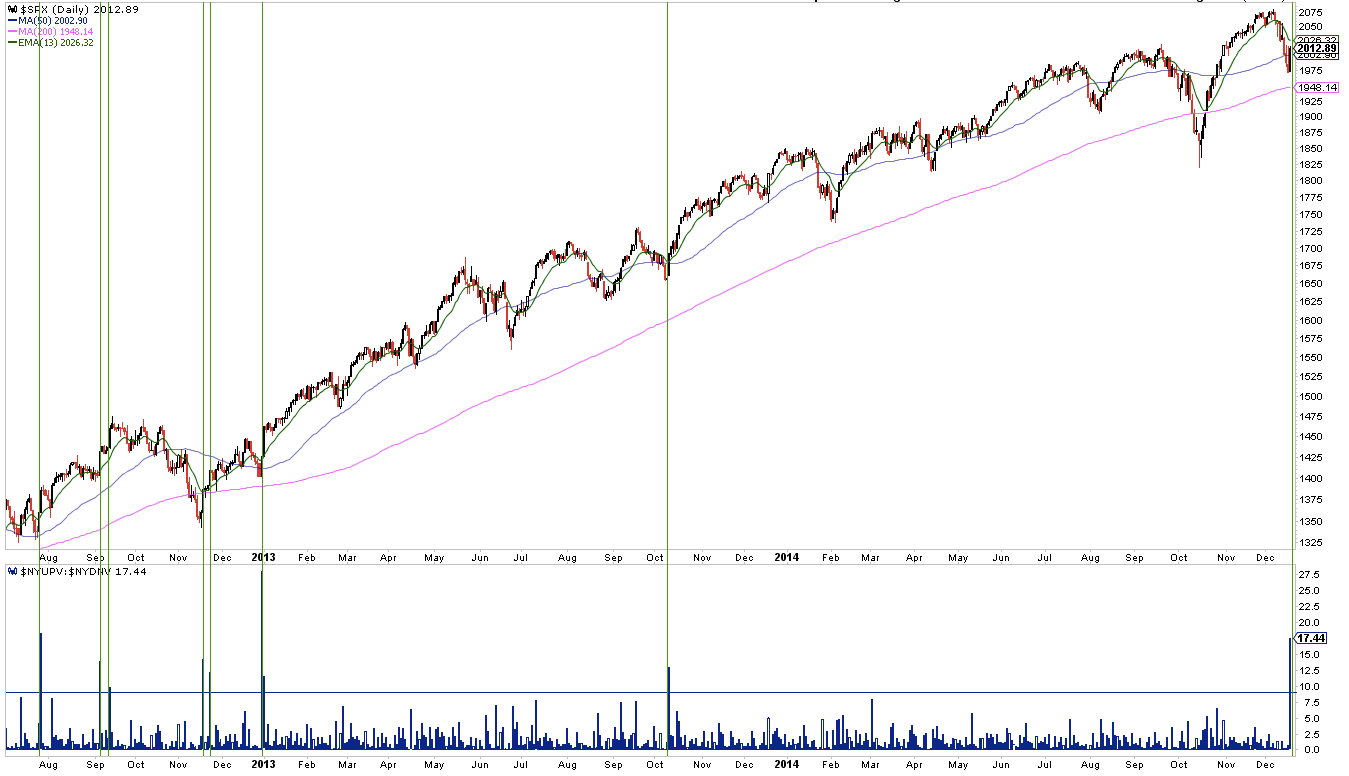
The returns following a MAD are generally favorable, especially two weeks out and longer. In other words, the market may consolidate its gains in the next two weeks, and then move higher. Dana Lyons presented the forward returns here.

That stocks experienced "follow through days" on Thursday and Friday improves the likelihood of further upside (top line).
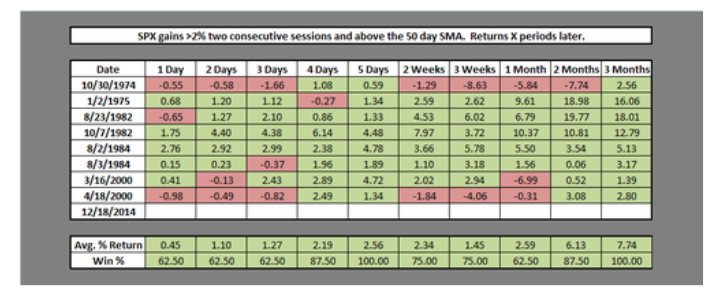
The second notable aspect of this past week's rally is that SPX rose more than 2% on two consecutive days. This is not uncommon when stocks are in a bear market; bear market rallies can be vicious. But SPX was above its 50-dma this week. A strong rally of 2% on consecutive days above the 50-dma has only happened 8 times before. Stocks were higher 5 days later as well as one month later every time. Chad Gassaway presented the forward returns here.
Add to these studies, this one from Quantifiable Edges: when the "capitulative breadth indicator" is at 11 or more (as it was on Tuesday), SPX has been higher after 20 days every time (post). At least for the next month, it seems unlikely that the current rally will fail.
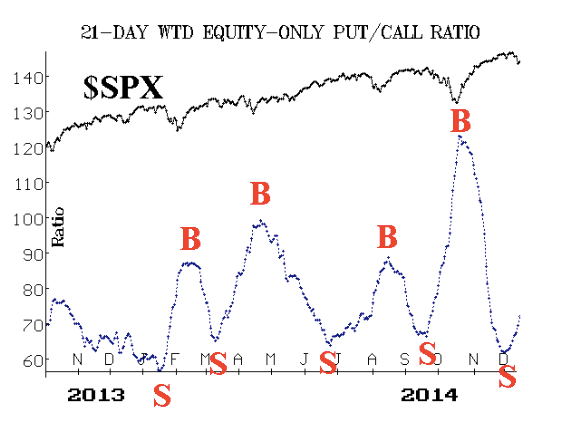
The picture is rarely perfect and that is the case now as well. Even at Tuesday's low, none of the CBOE put/call ratios reached an extreme. The weighted average equity put/call ratio is still low (chart from McMillan).
The other clear risk to equities is the price of Oil. The fall in equities was related in part to the plunge in oil prices; the rise this past week likewise corresponded with oil prices rising the last four days. Another plunge in the price of oil could easily unhinge equities once again.
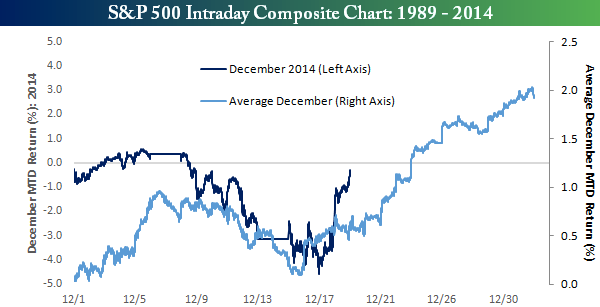
On balance, there seem to be good reasons to expect the indices to trade higher over the next two or three weeks. This period also corresponds to the holidays. The movement in stocks this year has been more extreme than normal, but it is still tracking the traditional pattern for December (chart from Bespoke).
The coming week is shortened by Christmas on Thursday. Trading on Wednesday is only for a half day. Seasonality is positive this week (in yellow) and also the week after, leading to New Years (chart from Sentimentrader).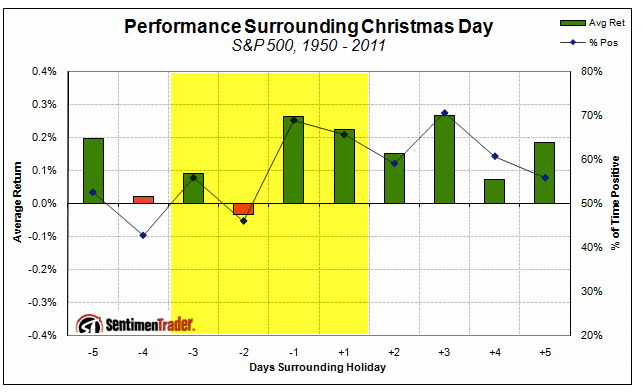
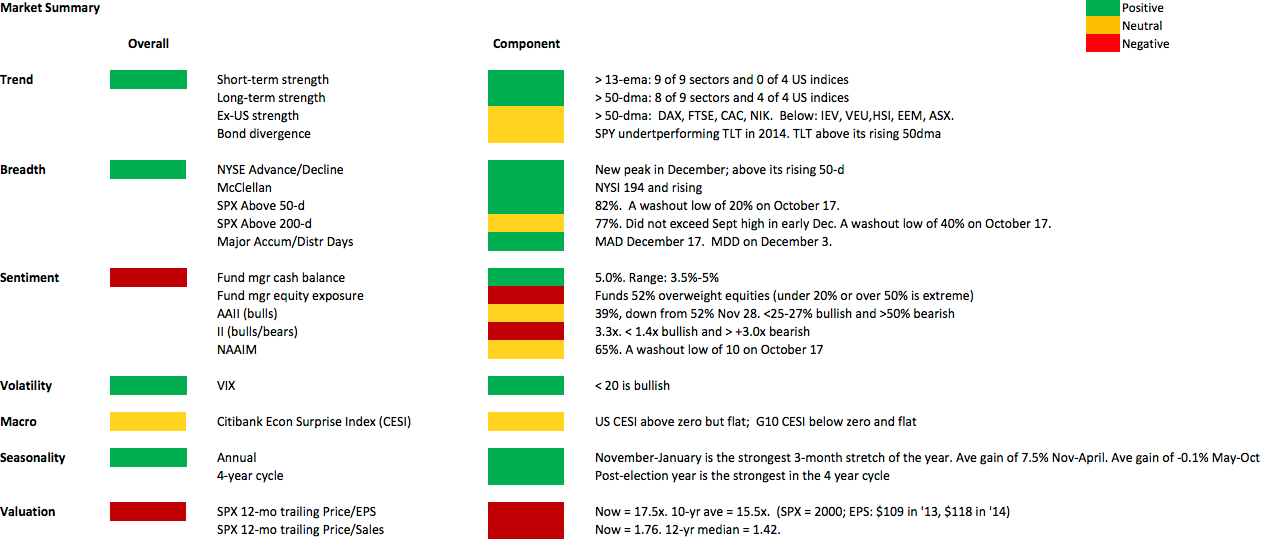
Our weekly summary table follows.
Enjoy your year end holidays. The Fat Pitch will return in January.
