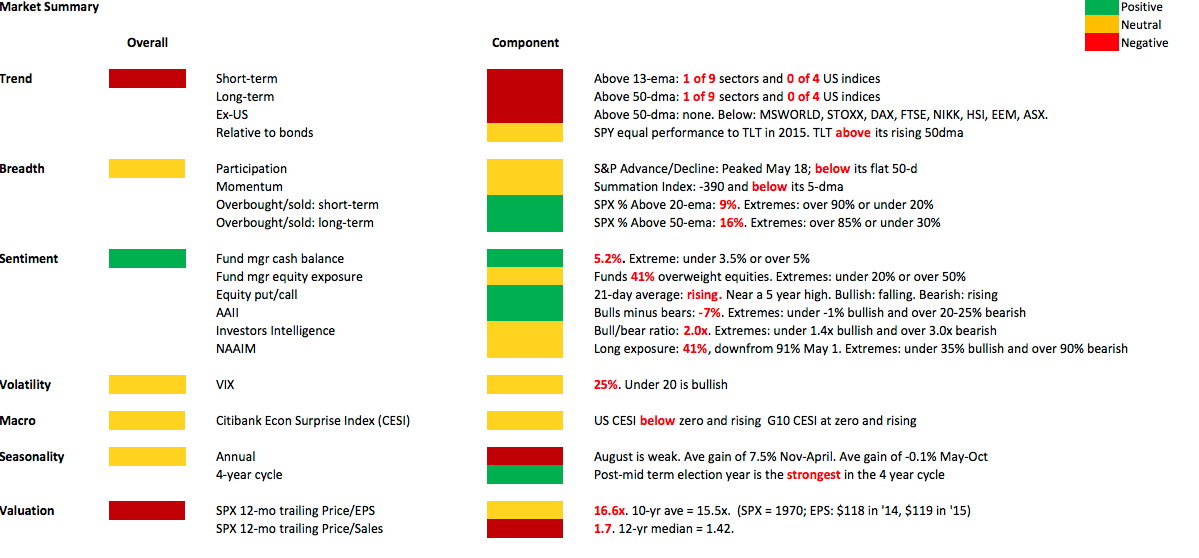
Summary: Strong downward momentum usually has follow through. US indices are mostly within a few percent of significant support levels. The selling this past week registered noteworthy extremes in breadth, volatility and sentiment. Friday probably will not mark the low, but risk/reward over the next month looks favorable.
For the week, SPDR S&P 500 (NYSE:SPY) and SPDR Dow Jones Industrial Average (NYSE:DIA) dropped 5.6%, NDX 7.4% and RUT 4.6%. For SPY, it was the biggest weekly decline since August/September 2011 and May 2010.
These numbers tell you that the decline this past week was primarily about large cap stocks. Not only did small cap stocks outperform but small companies within SPY outperformed larger ones.
Investors will come up with any number of reasons for the sell off. To us, the most important aspect is this: 80% of the selling over the past two weeks has taken place overnight. In fact, before Friday, cash hours showed a gain over the prior 8 trading days. SPY has lost $9.30 overnight since August 10. That date corresponds to the decision by the PBoC to allow the yuan to depreciate, which set off a cascading effect in other currencies.
There have been few earnings catalysts during this selloff, as most companies have finished reporting 2Q results. Macro data has also been light and positive: housing starts rose to a new 8 year high and retail sales recovered to post a 2.3% annual gain in real terms in July.
The FOMC, meanwhile, remains divided on whether to raise rates in September. The probability of such a hike fell this past week, but it is still higher than it has been for any other month in the past.
That the main catalyst for the selloff was events outside the US suggests that the selling is more likely to be relatively short-lived and contained.
Let's look at an example. At its worst, the 1997 Asian financial crisis, which involved currencies throughout the region losing 50% of their value and large loan packages from the World Bank and IMF, resulted in SPX losing only about 5% over two weeks in August. SPX remained in choppy turmoil the remainder of August, then rose 8% in September. The crisis spread over the coming months, but the downside never expanded and the overall trend in SPX was higher.
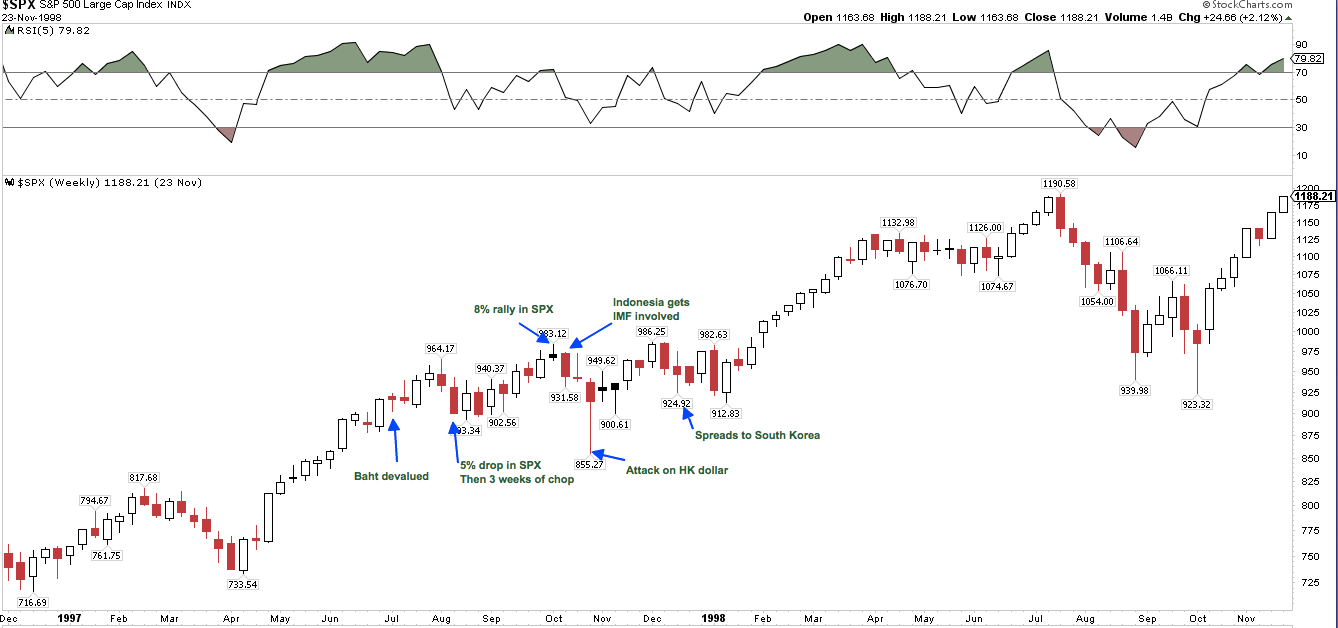
Could there be more downside now? Of course. We don't know how far this will spread. And the 1997 Asian crisis took a half year to play out fully. US markets could be roiled into next year. But 1997 was a correction; it was nothing like a bear market.
That the catalyst for the selloff is outside the US and not related to the US economy or sentiment is critically important. Many have jumped to the conclusion that the stock market is topping and headed into a bear market. This is possible, of course, but not very likely.
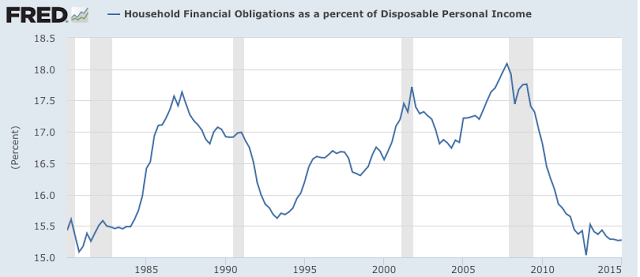
Bear markets most often start because the economy is heading into a recession. In the current situation, employment growth remains the strongest since the 1990s. There are modest signs that wages are picking up. Household gearing is very low and has ample room to expand (chart below). All of this suggests a foundation for consumption to expand, not contract. There are not many warning signals flashing that suggests a recession is imminent (read further here).
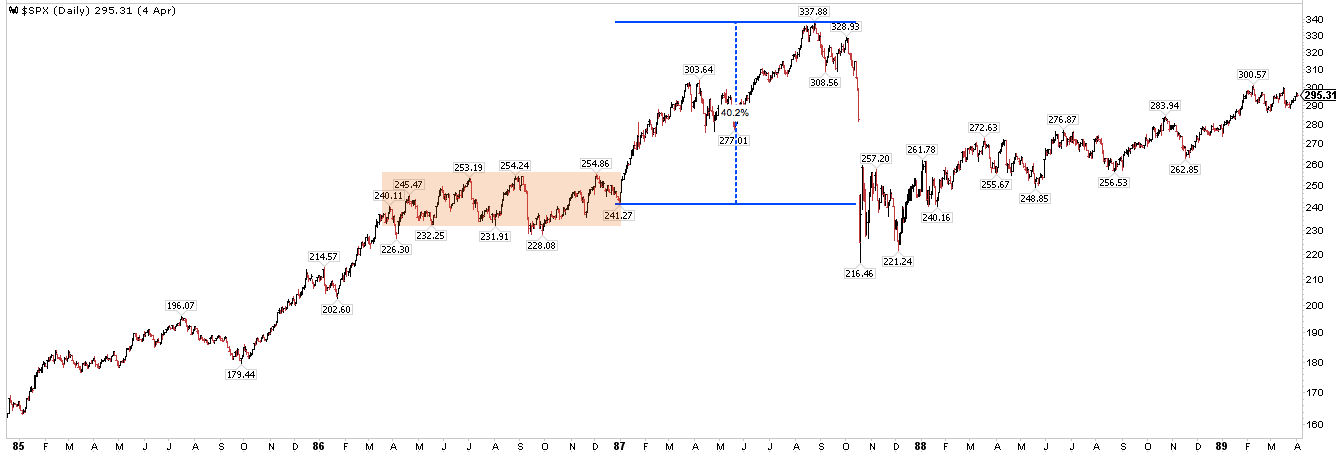
Bear markets sometimes start because of excessive investor sentiment. Both 1987 and 2000 fit into this group. But in both cases, sentiment reached an extreme because the pace of equity appreciation was extraordinary.
In 1987, SPX rose 40% in the final 7 months; NDX rose 50%. In 2000, NDX tripled in the final 5 months. Sentiment was definitely frothy at the end of 2014, but the current situation is nothing like either of these. If anything, the current trading environment most resembles 1986, not 1987.
After rising strongly in the past 3 years, US stocks have been moving sideways in 2015. Even after this week's selloff, SPX is down just 3% for the year. Unless they were overexposed to commodity sectors, most investors will not be much worse off than that. Healthcare and discretionary stocks are higher and most other sectors are down a few percent like SPX. The carnage has been fairly concentrated, at least so far.
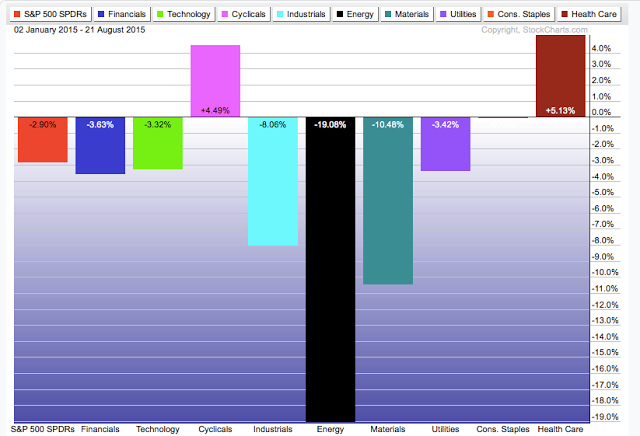
A lot has been made about how a large number of stocks are already in a bear market, having fallen more than 20% from their all-time high. This is relevant if an investor chose the worst companies and bought at the exact high. Otherwise, it is a meaningless and misleading statistic.
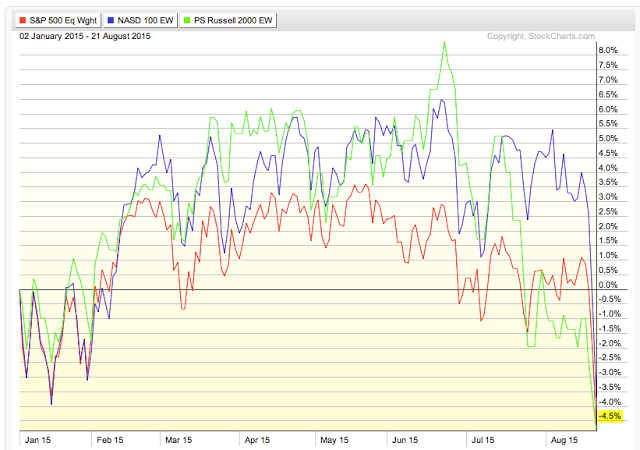
True, the average small cap stock is down more than 10% from its high last month. But an investor who owned an equal portion of every stock in either the SPX, NDX or RUT is down less than 5% in 2015. At the start of the week, that same investor would have been up for the year by 4% in NDX and 1% in SPX.
For several weeks, we have mentioned that SPX has fallen by at least 7.5% every year since 1995; that targeted a price drop to 1975 or lower. On Friday, SPX closed at 1970 (analysis from Cobra).
Until Friday, SPX was in the same trading range it had been in since February. The sell-off Friday put it near what should be a strong support level from earlier this year and a year ago. What is concerning is how quickly support gave out this week. It could continue to do so. But the area between the Friday close near 198 to the December low at 195 (1.5% lower) should hold on the first touch.

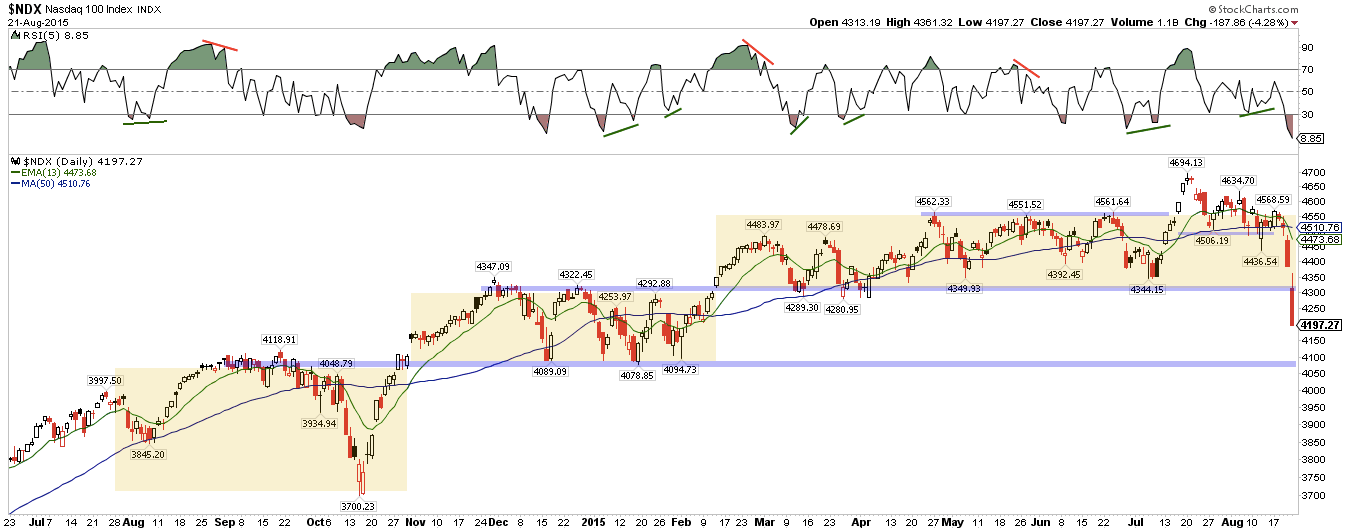
NDX is very similar to SPX, but the December low is about 3% lower. RSI(5) is 8, the lowest its been since August 8, 2011 and May 17. 2012. In both cases, NDX bounced and then made a lower low. That's a reasonable guess at what happens next, based on the price pattern. Strong momentum, either up or down, normally takes time to dissipate. In any case, like SPX, there is no evidence that buyers are interested: both indices closed on their lows of the week.
As an example of how long a major index can stay in a sideways range, look no further than RUT. It's in the middle of a range that extends back 20 months to December 2013. The February 'breakout' started to fail in July, as we noted, and confirmed this past week. The December low is 2% lower and the bottom of the range is 5% lower. There's a clear head and shoulders pattern that has a measured move to the December low.

Could all of these indices breakdown to the October lows? For SPX, that would imply another 9% fall.
If DJIA is the leader, the answer is yes. It started to break down first, in June, and is now only 2% from the October low. RSI(5) is as low as early August last year; momentum carried the index down another 1.5% in the following days. Risk/reward over the next month was very favorable.
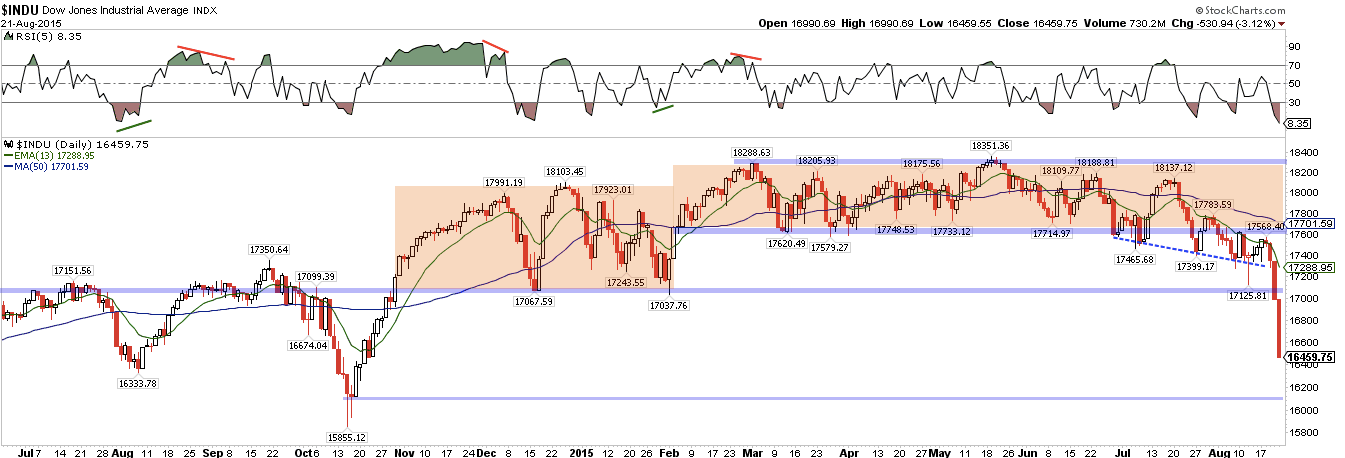
All of the indices are showing lower lows and lower highs: that is the definition of a downtrend. All broke support and none are showing the presence of interested buyers of size.
The downward momentum was very strong. How does that usually play-out going forward? We've noted the RSI pattern above. Let's look at the sell-off pattern.
SPY dropped more than 3% on Friday. It was the first drop of more than 3% in a day since 2010 and 2011. What happened next? Each prior case was followed by further selling (arrows), as well as snap back rallies. There's no consistent pattern as to whether the rally or the lower low occurs first. Shown below is the period in 2011.
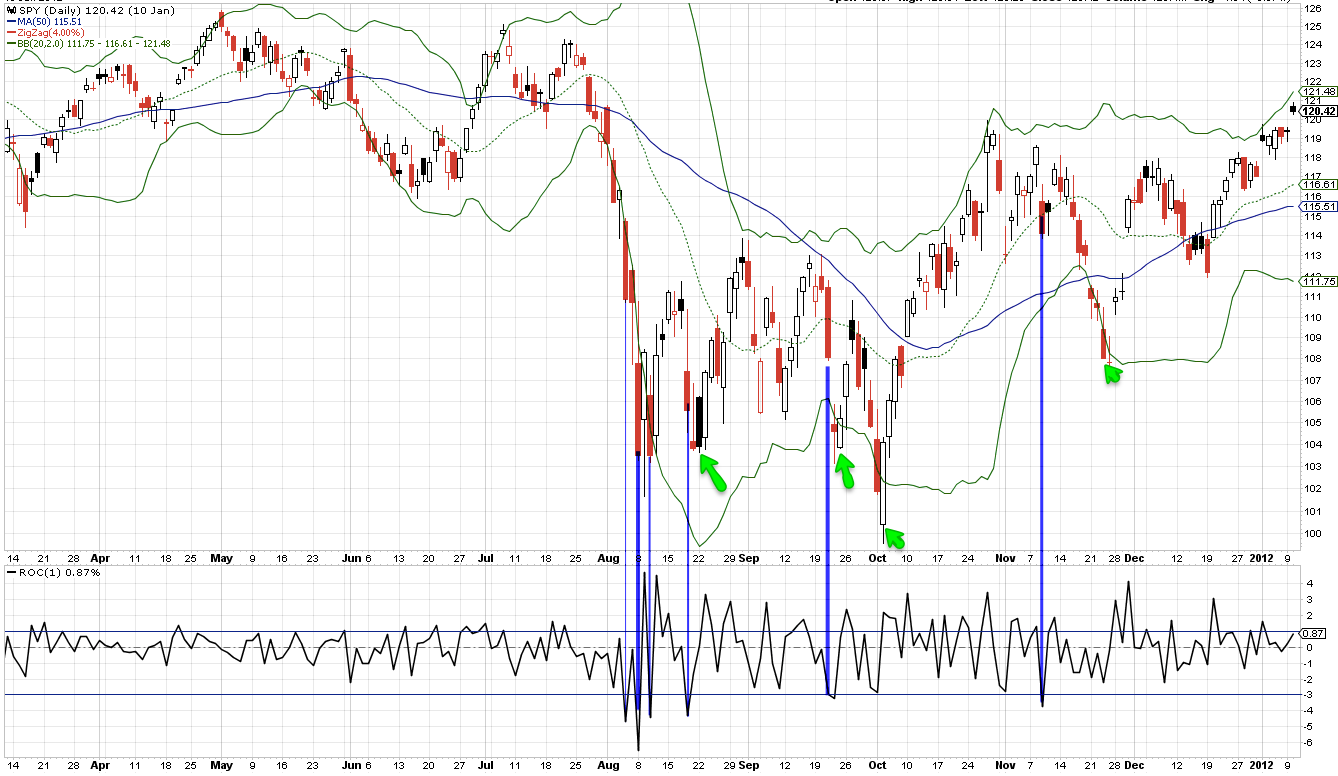
The next chart shows the period in 2010. The pattern is the same in both cases.
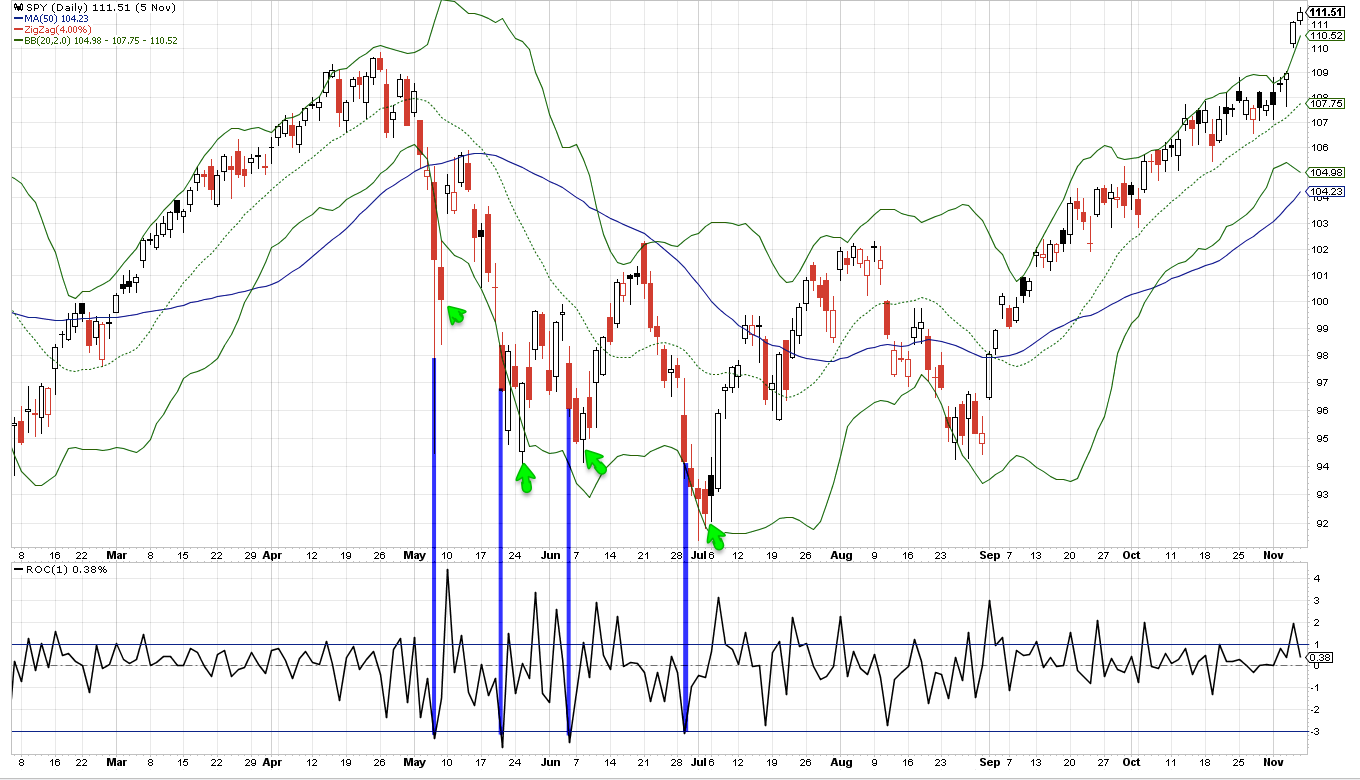
In the 2003-07 bull market, SPX fell 3% in one day twice: March 2003 and February 2007. The pattern was the same as in 2010 and 2011: snap back rallies and a lower low. The latter case is discussed further below.
VIX spiked 46% on Friday. In the past 10 years, it has spiked more than 40% only 3 times: February 2007, August 2011 and April 2014. In each case, VIX rose further in the days ahead and SPX registered at least one lower low. But all of these spikes came close to the ultimate low in the cycle, from which price rose over the next month. That was true even in August 2011; SPY rose nearly 10% later that same month. Again, risk/reward was favorable over the next month.
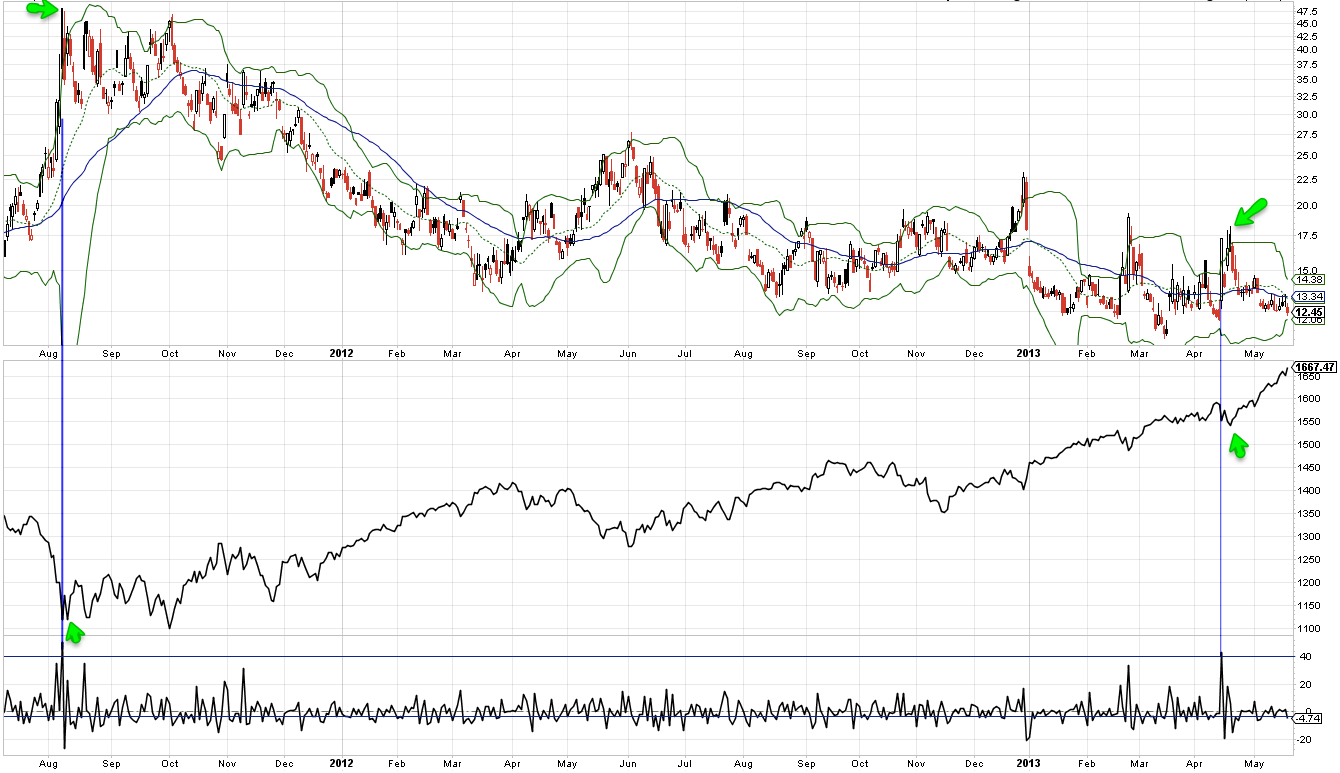
Over the past 3 days, VIX has spiked higher by more than 100%. The only other time in the past 20 years that this has happened was in the August 2011 period highlighted above.
Investors should be prepared for the lows on Friday to be tested or exceeded in the week ahead as downward momentum is worked off. Sharp sell-offs and high volatility in the past implied sharp snapback rallies. It is likely to be turbulent.
As mentioned earlier, many believe a new bear market is beginning. Investors are now clearly fearful. This sentiment has probably reached an extreme.
In the past week alone, there were inflows of $6b into US money market funds. Over the past several weeks, inflows equal those during other crises (data from Barclays).
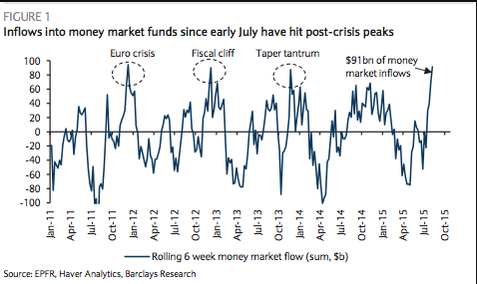
As a reminder, each of those corresponded to relative lows in equities.

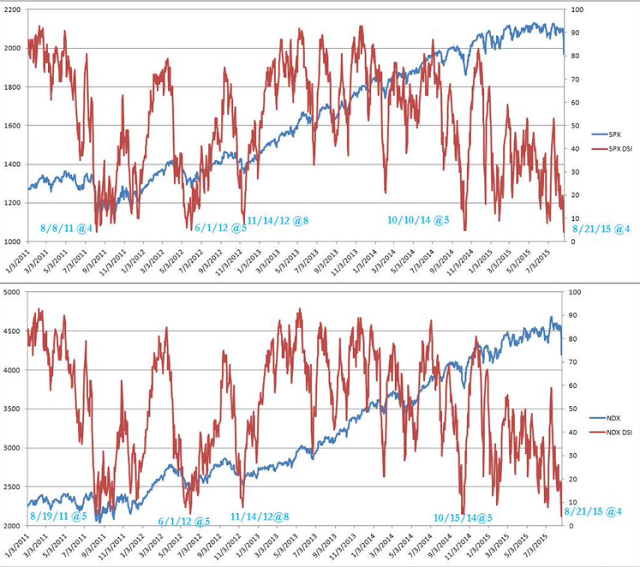
The daily sentiment index (DSI) closed at 4 on Friday, for both SPX and NDX. What usually happens next? In the case of SPX, it corresponded with the exact closing low in August 2011 but was a day early in June 2012 and 3 days early in October 2014 (data from Chad Gassaway).
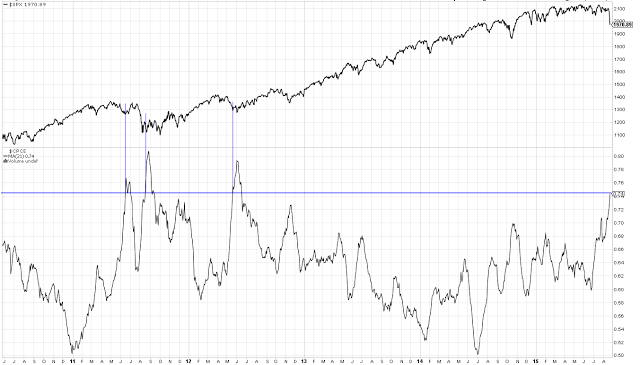
21-day equity-only put call is now at levels at which SPX has been at or very near a low in the past 5 years. In June 2011, SPY was at a one month low from which it rallied 7%. In August 2011, it had already bottomed and was starting a 9% rally. In May 2012, SPY bounced and then lost 2% into its durable low. On a one month basis, the risk/reward was very good in all cases.
Sentiment suggests that downside is probably limited relative to upside over the next month. It could be, for example, that the October lows in SPX and NDX are eventually visited after a reaction higher to work off bearish sentiment. That is, in essence, how the August 2011 low developed.
The selling on Friday created a major distribution day (MDD). This means that more than 90% of the trading volume on the NYSE was down. This is an extreme. Two points are relevant. First, an MDD near a price high usually initiates significant downside; in other words, it's about to get much worse. Second, an MDD after the index has been selling off is usually close to the low, but rarely the exact low; in other words, it's a sign of capitulation. December 10, 2014 and January 28, 2015 are two recent examples. In both cases, the selling momentum took a few more days to dissipate. That's likely the case now.
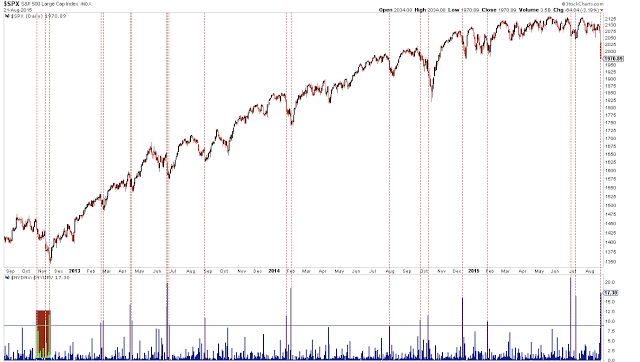
Trin was 2.9 on Friday. That's an extreme; sometimes it marks the low but many times momentum carries the index a bit lower.
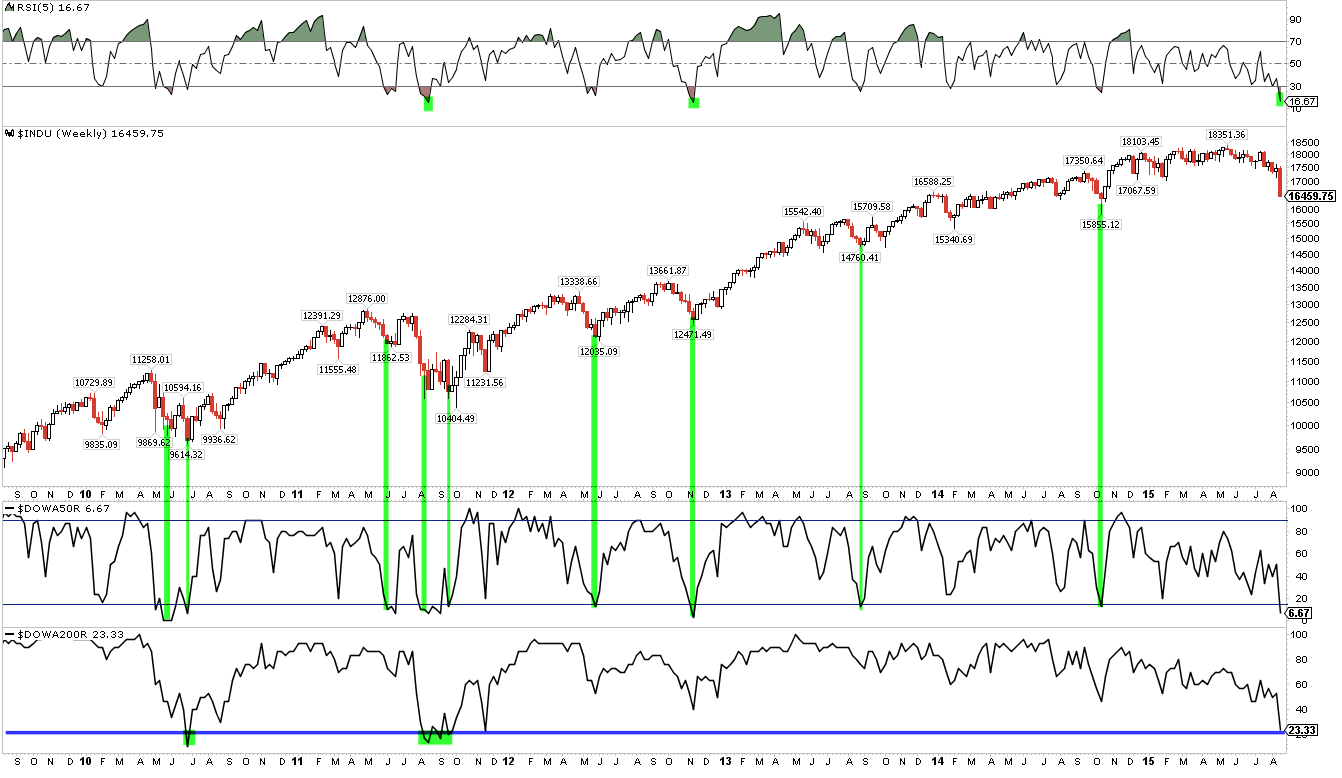
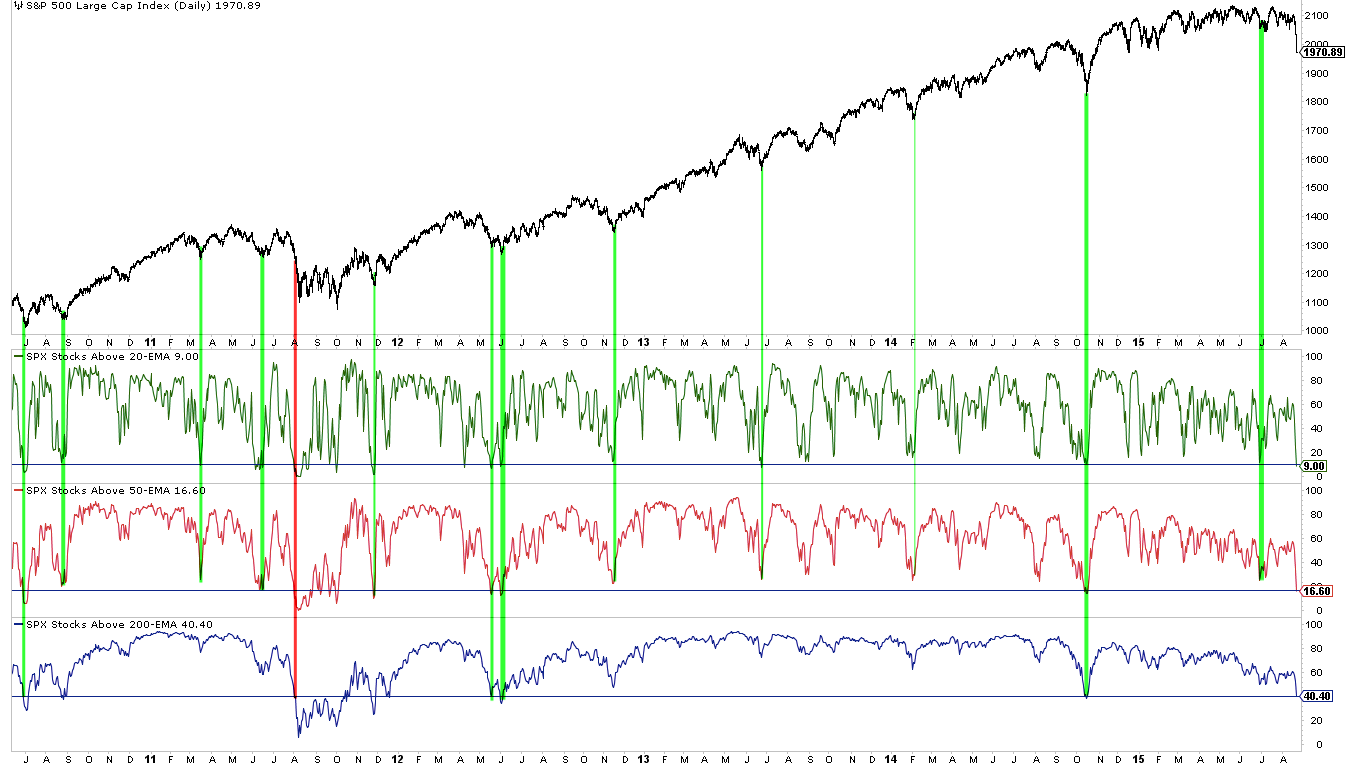
As a result of the selling, breadth is at or near a washout. The best example comes from the DJIA, which has led the downside. Less than 10% of the stocks in the index are trading above their 50-dma on weekly close basis, and less than 25% are trading above their 200-dma (lowest panel). Moreover, weekly RSI(5) is 16 (upper panel). The end of the weeks of June 28, 2010 and August 15, 2011 are the only similar cases in the past 6 years. The index moved higher in the next month, or longer, both times. Using just the 50-dma, similar cases are highlighted with green lines; the next week may move lower but risk/reward is probably skewed to the upside over the next month.
Breadth in SPX is better but not too different. Last October and May/June 2012 are the most recent cases that were similar to today. Mostly, these breath levels were within 2% of the lows; August 2011 was not. In this case, the low came when just 7% of stocks were above their 200-dma (lowest panel). But that was the one time in 6 years where the bottom simply fell out; none of the others were like it.
Indices sold off hard this week. That support levels were shredded is a reason to act causally. Moreover, strong downward momentum usually has follow through. But US indices are mostly within a few percent of significant support levels. The selling this week registered noteworthy extremes in breadth, volatility and sentiment. Friday probably will not mark the low, but risk/reward over the next month looks favorable.
Our weekly summary table follows.
