Summary
Failed sell-offs lead to failed rallies. This has been the recurrent pattern for the past four months. There is unlikely to be a sustained move higher until there is a more complete sell0off lower. Risk remains to the downside.
Stocks rose strongly a week ago, then promptly fell back lower this past week. This has become a regular pattern in 2015. For the week, SPDR S&P 500 (ARCA:SPY) and the Russell 2000 lost 1%. The NASDAQ 100 (NDX) lost 1.6%.
Overseas, Europe fell 2.2%. Emerging markets were the relative strength winner, losing only 0.4%.
Crude gained more than 8%. It has now risen 5 weeks in a row.
The set-up coming into the week was this: the indices were at the top of their recent range and not yet overbought. As we said then, a test of strength was at hand, as bullish markets become and remain overbought while trend-less ones fail at moments like these.
In the event, the markets once again failed.
Our bottom line remains as follows: failed sell-offs lead to failed rallies. This has been the recurrent pattern for the past four months. There is unlikely to be a sustained move higher until there is a more complete sell-off lower. Risk remains to the downside.
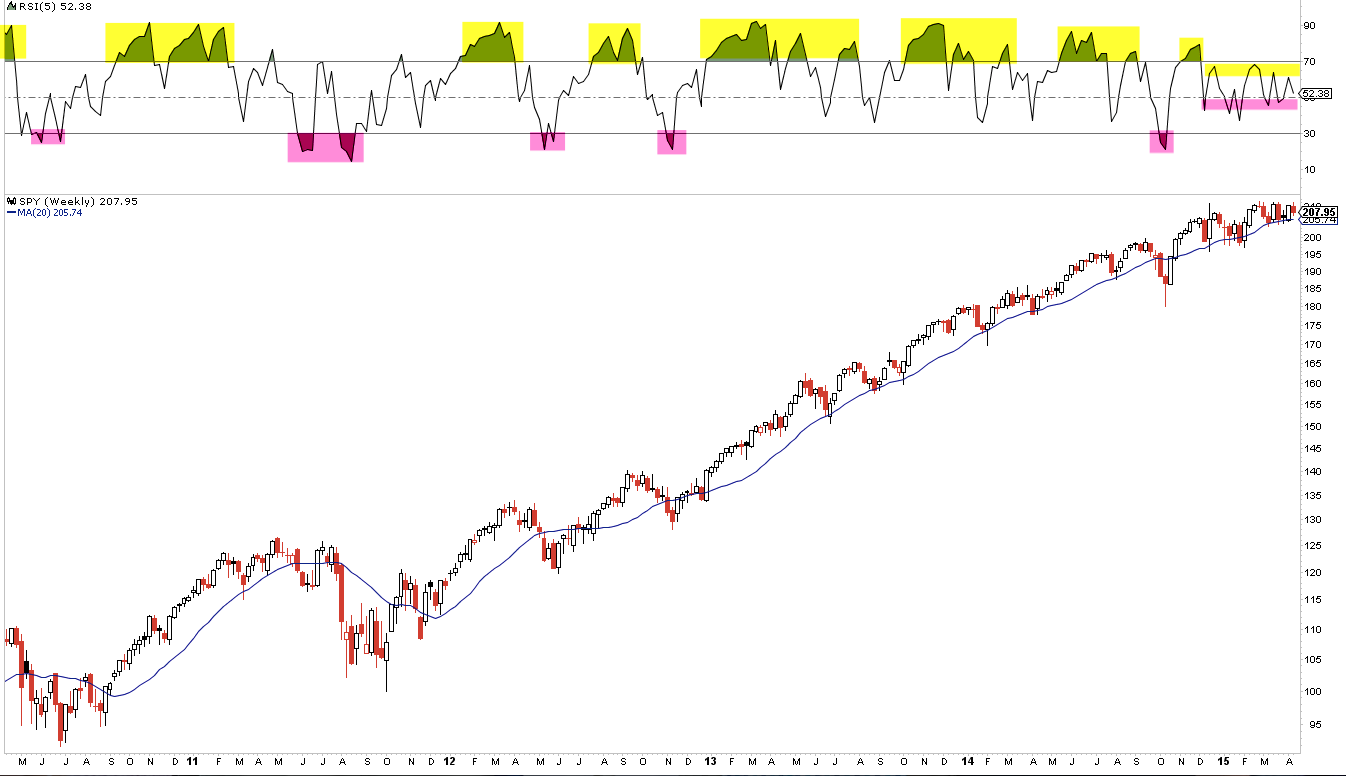
This pattern is most easily seen on the weekly time frame. RSI became overbought during the prior multi-year run higher (yellow shading, top panel); since December, every rally has failed with lower momentum. But, instead of resetting with a larger sell-off, the dips have been short and shallow (pink shading). This has produced a trend-less market.
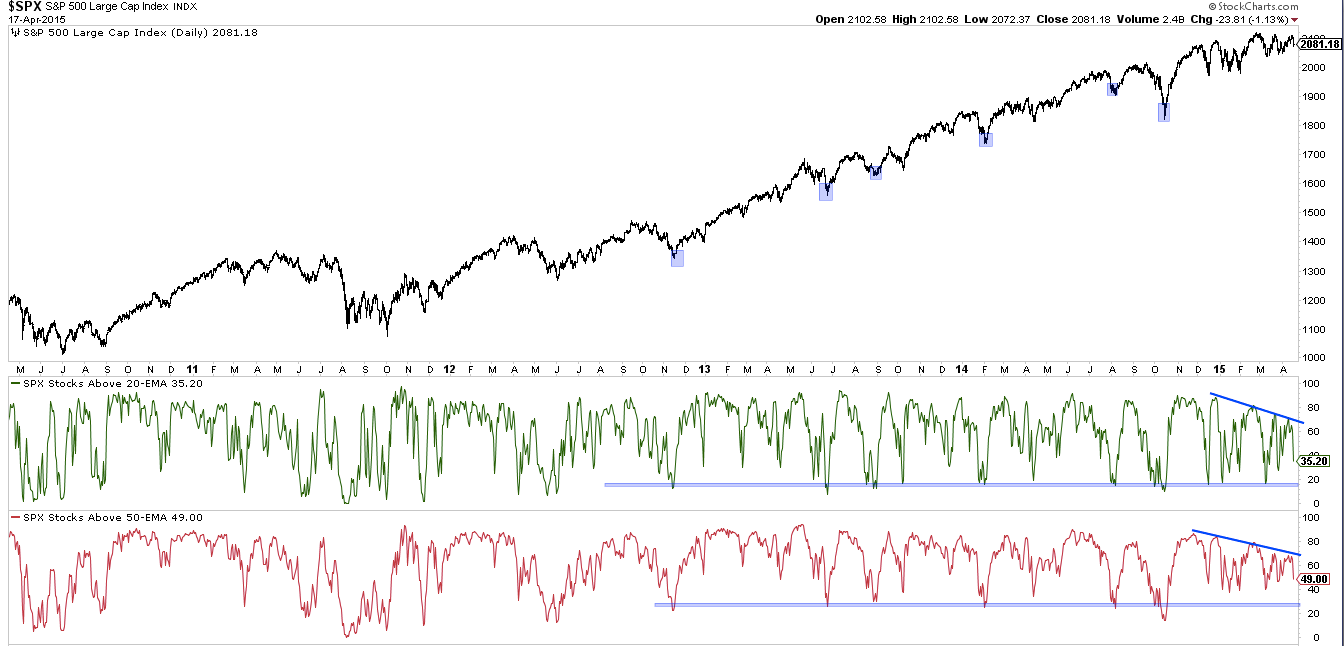
This pattern is also seen in breadth. The pattern in 2015 has been for the market to drop at successively lower highs in breadth (bottom two panels). If the market is going to reset more fully, the percentage of SPX stocks over their 20-ema and 50-ema should drop to 20% and 30%, respectively (blue shading). That happened 5 times during the go-go 2013-14 bull market but hasn't happened once in the past 6 months.
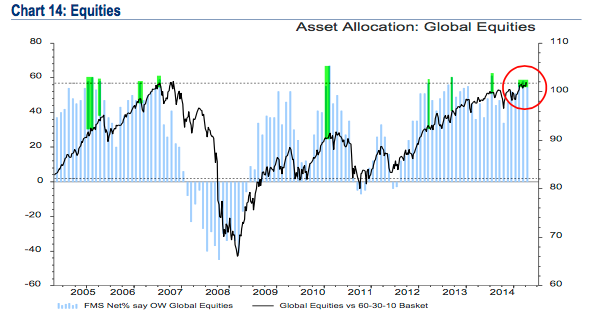
Market participants are clearly conditioned to jump on every small decline. Equity exposure by fund managers surveyed by BAML has been 1 standard deviation over the long term mean for three months in a row for the first time in the survey's history. Similar instances are highlighted in green: long equities has had a poor risk/reward profile over the next month (chart from BAML; more on this here).
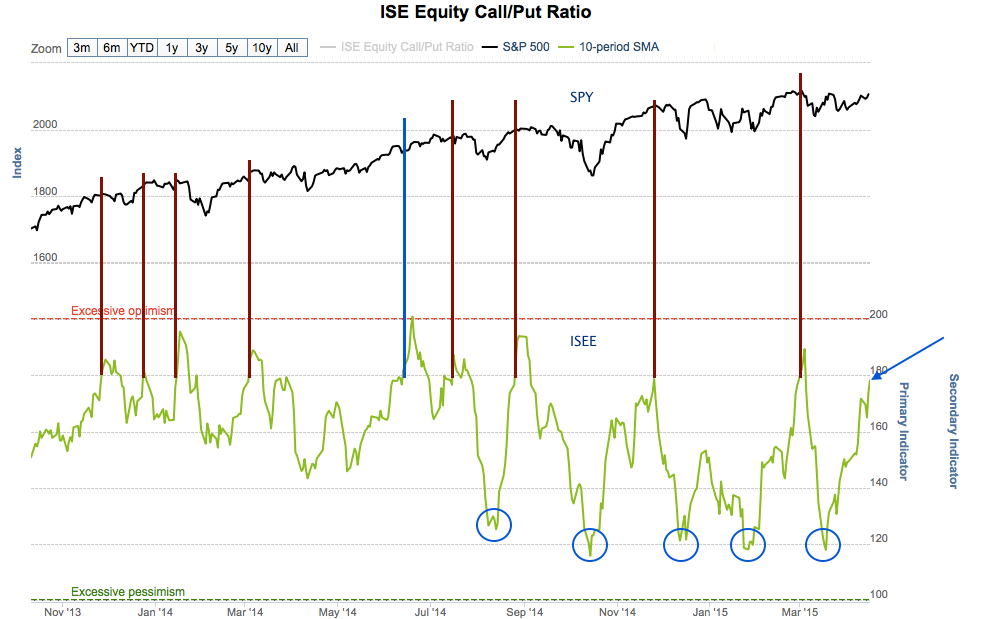
Similarly, the ISE equity-only call/put ratio over the past 10 days is at a level where the market has most often (8 of 9 times) made little upward progress but been at risk of more significant downside over the next month (data from Sentimentrader).
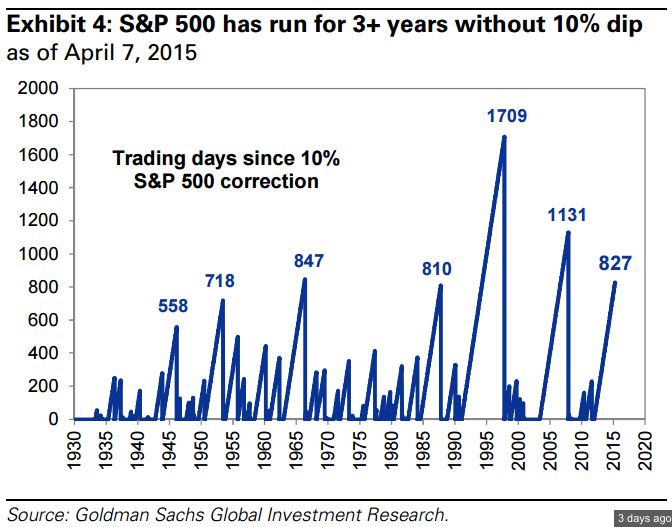
A shakeout in bullish sentiment can occur through either price or time. In other words, a large drop in price is not a precondition for a reset. That said, it is noteworthy that it has now been 835 days since the last correction of 10% or more. Prior to the 1990s, a streak that long was virtually unheard of (chart from GS).
So the market seems unlikely to make much upward progress until it ultimately resolves lower. Will that begin this coming week?
If last week was a test of whether the market could show strength by becoming overbought, this week is the opposite, a test of whether it can start to become oversold.
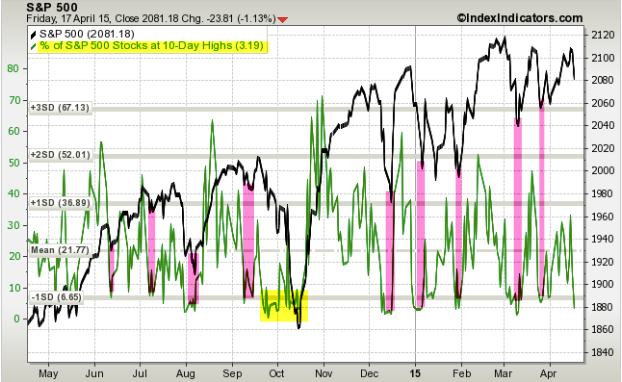
The percent of SPX stocks at a 10-day high is just 3% (green line). In the past year, SPX has bounced higher 14 of 15 times within 5 days by an average of 1.2% (black line). The one failure was in September ahead of the October low (yellow shading). Recall this was also the last time the percent of SPX stocks above their 50-ema also sank under 30% (chart earlier). So, does the bounce fail to materialize like in September? Sentiment suggests yes but the recent pattern has been for the market to reverse higher instead.
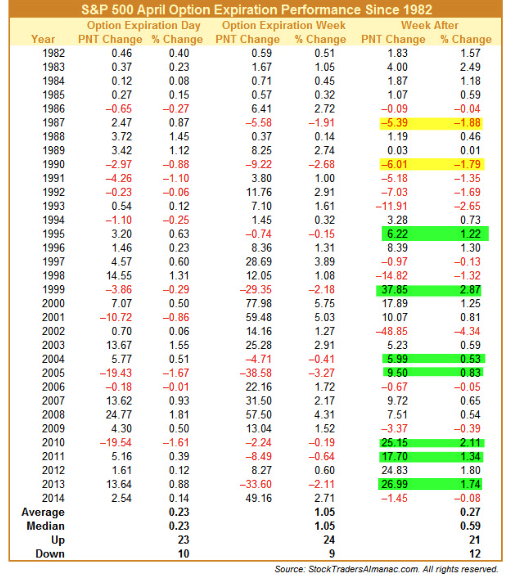
Two possible tailwinds for a bounce exist. First, when April OpX week has closed lower (like this past week), the following week has been higher the last 7 times in a row and 7 of the last 9 times in the past 30 years (data from Almanac Trader).
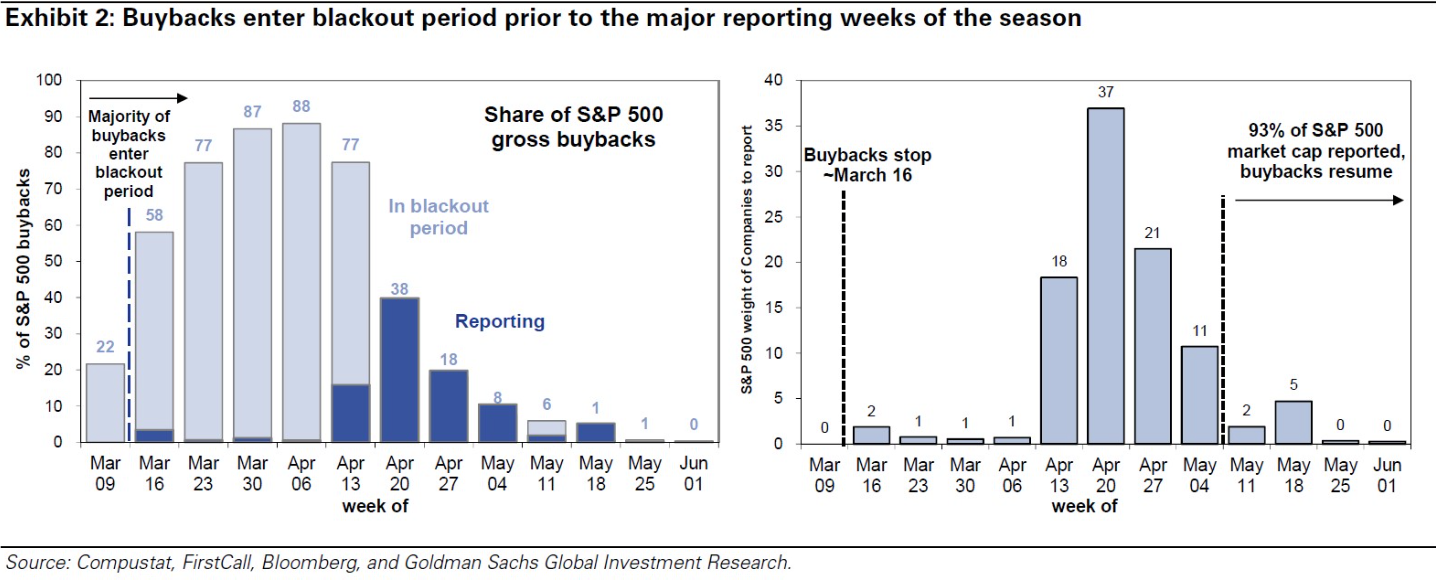
Second, the buyback blackout window begins lifting as companies report their 1Q results. Buyback demand picks up especially strongly after this coming week (data from GS).
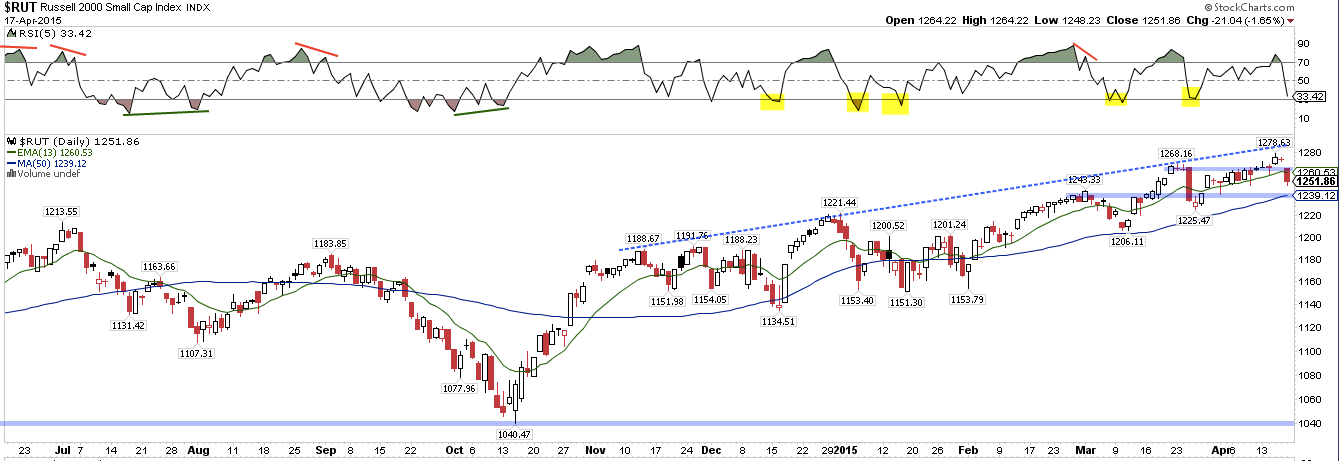
Price is not particularly enlightening right now. Small caps (RUT) have been leading, making new highs this week, but that "breakout" failed. The longer term trend is higher. Another move down and momentum (top panel) will be as oversold as at prior lows (yellow shading).
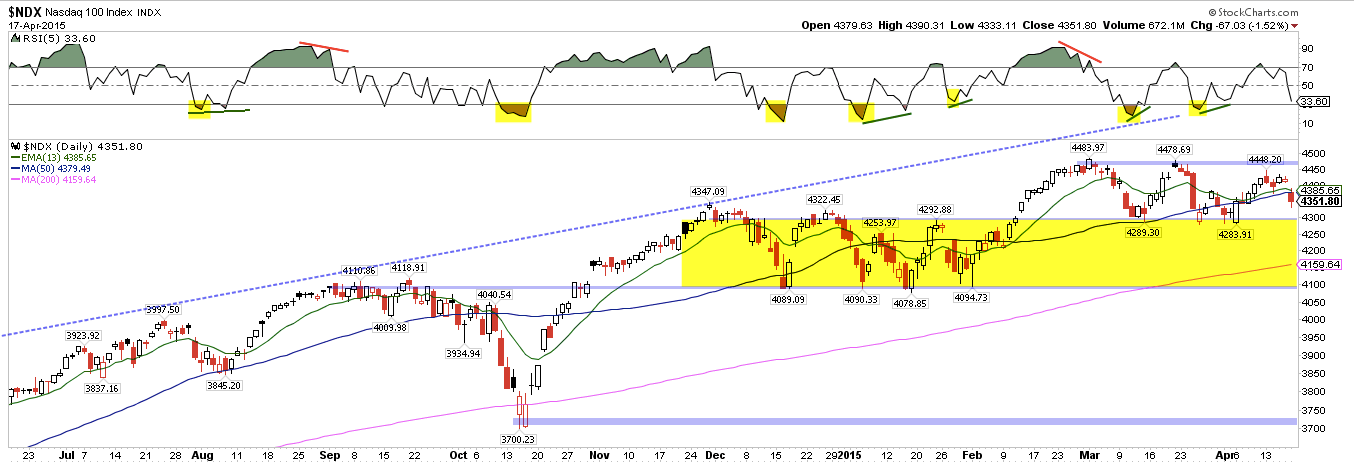
NDX is now lagging. It made a lower high this week and lower low last week. Overall, price has been in the same trading range for three months. Momentum has been more oversold at prior lows; also note that there have been two pushes lower in momentum before the better low in price. This suggests the sell off is not over and a bounce would likely fail.
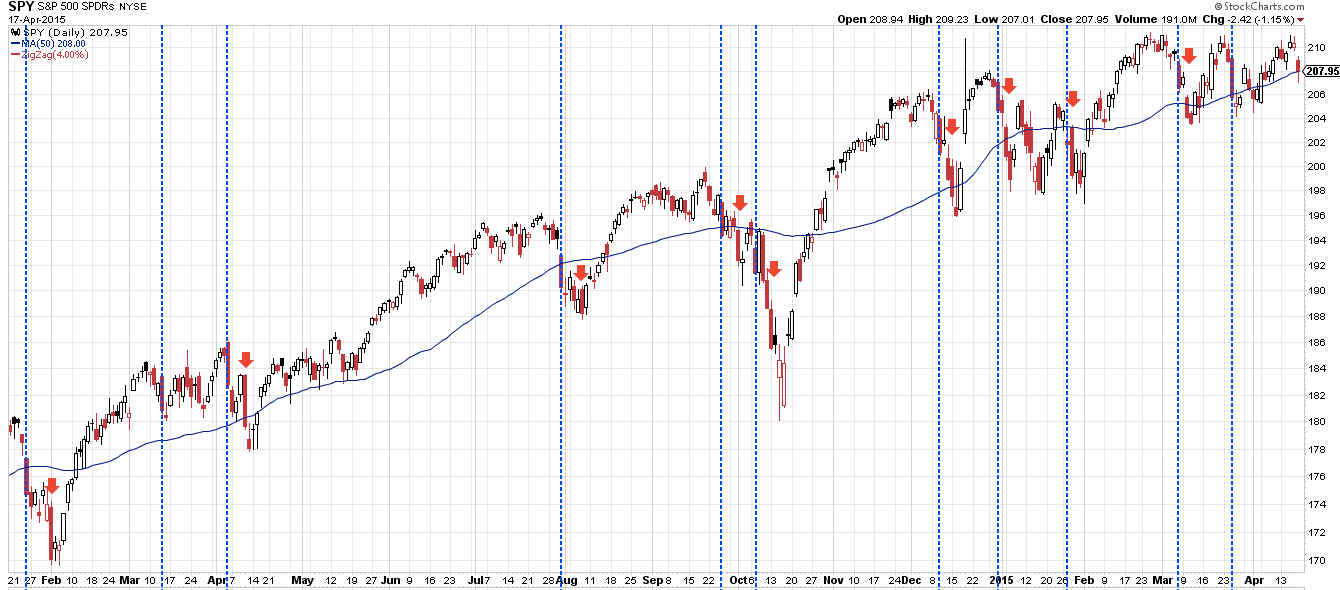
SPY looks largely the same as NDX. Moreover, SPY fell more than 1% on Friday. In the past, 1% down days have most often been followed by a lower low in price. Also, there has often been a second 1% down day shortly after the first one (first 1% down day shown with a blue line; second 1% down day shown with an arrow). In other words, any bounce is likely to fail.
On a short-term (hourly basis), SPY enters the week oversold (top panel, below). It's also down two days in a row already and down again on Monday would set up a Turnaround Tuesday. Again, it's not hard to imagine a bounce early in the week. On weakness, weekly S1 is near 206. On strength, R1 is back at 210. The pivot is 208.7, which also happens to be the 13-ema. It's becoming messy.
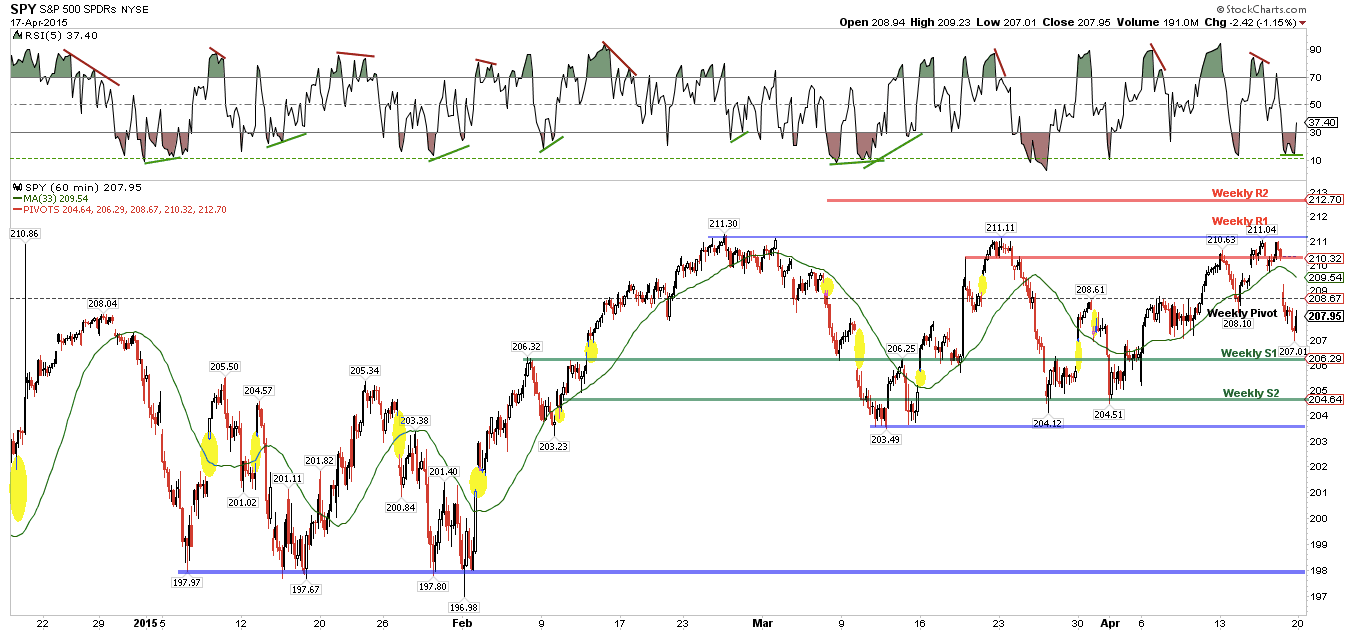
The 100-dma has been a good support level on most sell offs. The exception was the one in October referenced above. As luck would have it, the 100-dma is just below weekly S1. This will be an important level to watch.

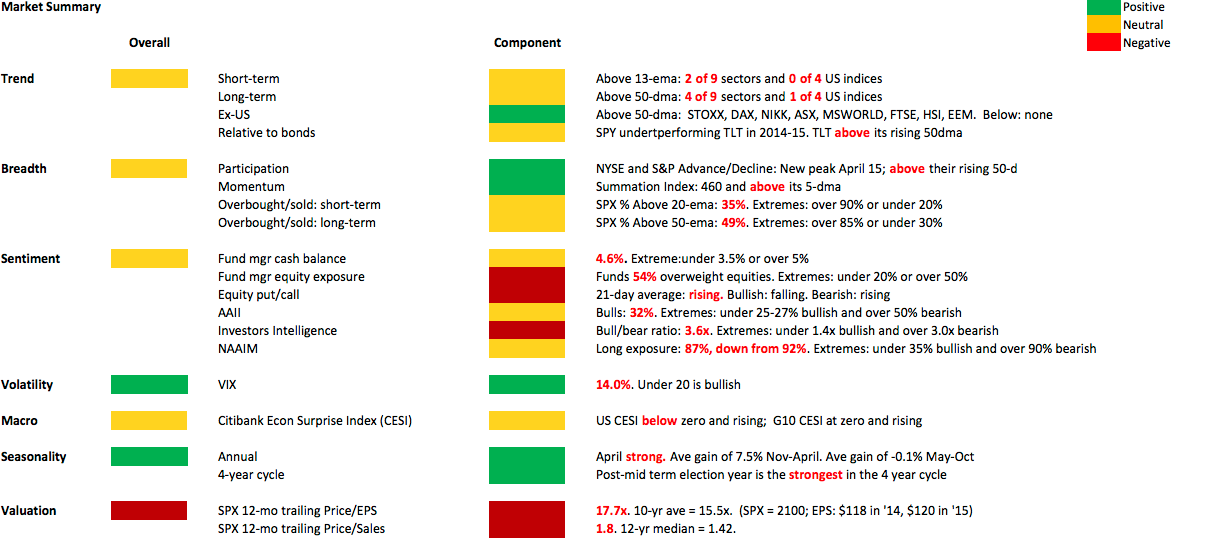
Our weekly summary table follows.
