
At the end of last week, US equities looked overheated short term and in need of a break (post). In the event, SPX lost 0.3%. The other indices were similar.
After a violent January in which equities lost 3%, February had a strong rebound. SPX and DJIA gained 5.5%; RUT gained a bit more. NDX was the leader, gaining 7%.
Two months into 2015, the market is being led by consumer discretionary, materials and healthcare sectors. Recall that in 2014, defensives were the clear leaders all year long. 2015 is starting off very differently; utilities are the biggest laggard and the SPDR S&P 500 (ARCA:SPY) is outperforming iShares Barclays (LONDON:BARC) 20+ Year Treasury (ARCA:TLT). But there's no clear theme so far, with some defensives and some cyclicals outperforming and others lagging (all charts in this post expand when clicked on).

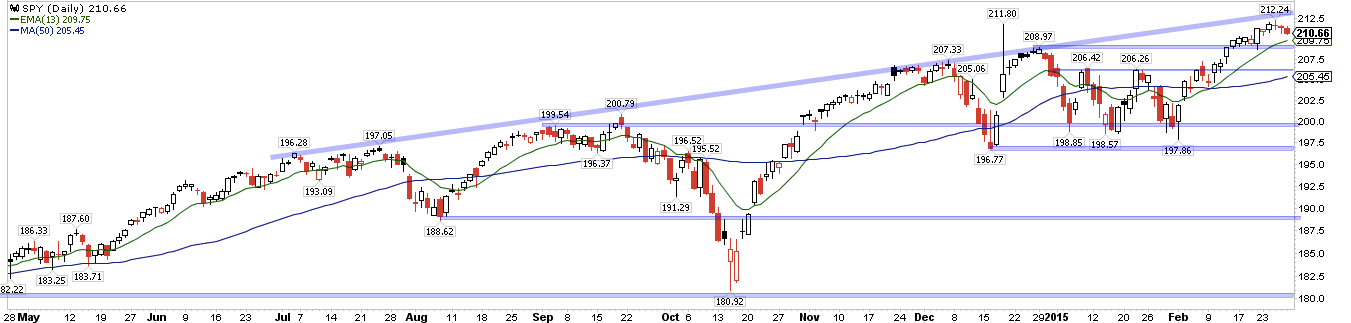
SPY has now risen 3 weeks in a row and then declined one. It has not touched it's rising 13-ema in a month and all of its moving averages are rising. This is the definition of an uptrend. The other indices are similar.
When SPY has risen 3 weeks in a row, it most often rises further for at least one more week. SPY has been up 3 weeks in a row 19 times in the past 4 years. In 17 of those 19 times (89%), it continued up at least one more week. In one of those 19 instances, SPY gave back half its gains before going higher (yellow arrow); and in just one instance, SPY gave back 100% of its gains (red arrow).

In other words, both trend and momentum suggest further upside. For the time being at least, we assume the trend higher continues.
The set up we have referred to many times in the past is shown below. After a strong initial thrust out of a low, SPY typically weakens to its rising 13-ema (green arrow). The yawning MACD closes (yellow shading in the lower panel) and RSI turns neutral (upper panel). After the first touch of the 13-ema, SPY at least retests its recent high, sometimes going higher (green shaded lines).

Nothing in technical analysis works perfectly every time, and this is no exception, but trend, momentum and the current pattern all suggest this is the most likely development ahead.
This coming week, the 13-ema will start near 210 which is also the weekly S1 level. On further weakness, weekly S2 is 209.4. 209.0 was the December 29th top, further adding significance to this level. On strength, 213 is the weekly R2 and also the trend line top.
NDX is the leading index. It rose 10 days in a row for only the second time in the past 18 years. That also shows strong upward momentum. Dana Lyons shows that NDX normally continues higher over the next several weeks (read his post here).
What is interesting is the context in which these 10 day streaks have occurred. Most often, it has been out of low, and the index has continued higher. The current situation is in the minority, as NDX is reaching a new 52-week high at the same time as it has risen 10 days straight. In the chart below, those instances are shown in red.

Instances where NDX is up 10 days in a row while hitting a 52-week high tend to continue higher in the next few weeks but end lower over the following several months. In other words, it has been an exhaustion pattern. This is important, as we will discuss further below.
One reason that pattern might be taking place now is Apple (NASDAQ:AAPL). Apple has risen 28% already in 2015 and its index weighting is more than twice that of the next largest company. That Apple has risen so quickly, and into a rising trend line, just as NDX is hitting a new 52 week high, is a watch out. Further strong gains in NDX are almost certainly predicated on Apple continuing to run hard.

Breadth is supportive of the rally in equities. The advance-decline line for both SPX and NYSE hit new highs this week. The McClellan Summation index is over 640 and rising.
Volatility is also supportive of the rally. VIX fell 7% this week and closed at its lowest weekly level in 3 months.
Sentiment, however, remains bifurcated. There is room for further equity strength short term but risk-reward on a one month basis now looks unattractive.
Equity put/call ratios are still falling from an elevated level. These normally start to rise, or have at least flattened out, before equities peak (vertical lines). This suggests the uptrend is not yet over (chart from McMillan).

Inflows into equity ETF and mutual funds have also been very light; in the past week, only $1.5b was added. Like the put/call ratios above, it suggests investors are only tentatively returning to equities after a rough start to the year (see chart from last week here).
But sentiment survey data tell a markedly different tale.
Investors Intelligence bulls now outnumber bears by 4.2 times. This is an extreme equalled only in late December 2013 (4.2x), early September 2014 (4.3x) and late November 2014 (4.1x). Each time SPX eked a further gain of a percent or so but then gave that, and much more, away over the next 1-2 months. The losses were 3.5%, 9% and 4%. In short, the risk-reward was clearly unfavorable.

NAAIM, similarly, shows active managers are 99% long equities. Their data series only goes back to 2006, but in that time, this is just the fourth instance where sentiment has been this lopsided long. It's an insignificant sample but both recent times (January and November 2013), equities added another 1-2% before giving all those gains back in the next month or so (data from Sentimentrader).

The chart pattern in each case was very similar and instructive of where the market might be right now. The chart below uses the three Investors Intelligence dates but the set up during the two dates from NAAIM are the same. In each case, after hitting a high in sentiment, SPX declined towards its 13-ema (green arrows) and bounced to retest the high over the following week. MACD closed its yawn and started to decline (lower panel), as did RSI (upper panel).

If past is prologue, SPX will meet its 13-ema, either through a decline or through time, and then retest its recent high before rolling over. It could take a week or several weeks before the rollover occurs.
Recall that both the BAML survey of fund managers' equity exposure and the CNN "Fear and Greed" index also hit bullish extremes recently (see charts here; BAML also show below). The message is the same as that presented above.

March is typically a strong month for equities. And, according to Chad Gassaway, the 5 prior times February has gained more than 5% (in 1970, 1975, 1986, 1991 and 1998), March has also been been higher (from Chart of the Day).

You'd be right to be a little skeptical about seasonality patterns right now. December and January are both typically strong, but recently ended down. And February was up strongly whereas it is normally a weak month. It's not clear why March should follow the typical pattern when the others have not.
The first week of March is normally strong (green box). Be aware that NFP data will be released on Friday; this is the largest macro event of the month (data below from Sentimentrader).

The typical pattern for most months is to start strong, get softer in the middle and then end strong. What is notable is that has been less true recently. Over the past year, the first 5 days of each month have more often been weak (red shading).

In summary, we think the uptrend has not ended: trend and momentum, supported by breadth, volatility, put/call and seasonality, all suggest some further gains. But the froth in longer term measures of sentiment has become extreme and strongly suggests that those further gains will likely be limited. On a one-month or longer timeframe, risk-reward is quite likely skewed negative.
Our weekly summary table follows.
