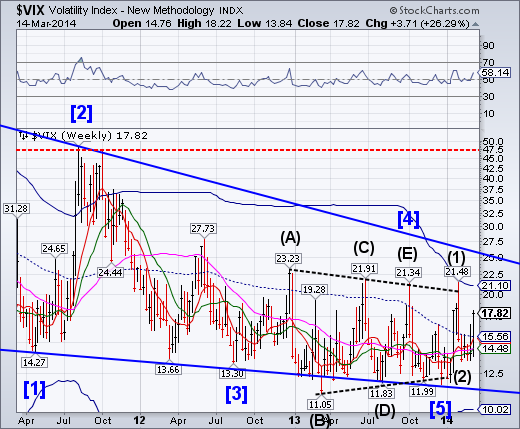
After days of late-session smack-downs, VIX finished Friday in the green and closed the week above all resistance levels but the Cycle Top at 21.10. This is the prelude to a probable run to the top of the chart that may occur before month-end.
SPX remains above the Wedge trendline.
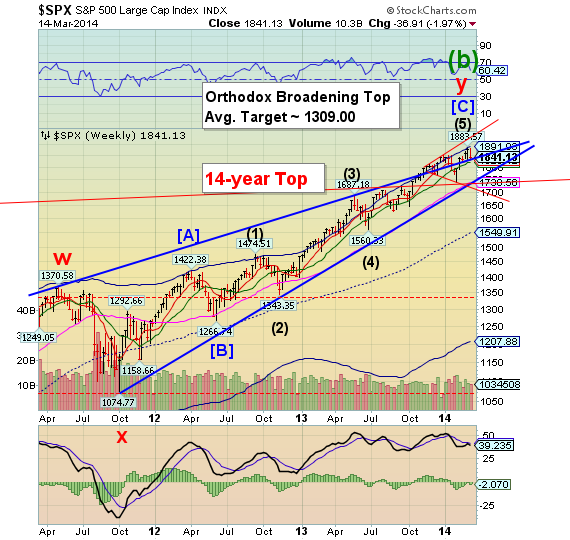
SPX was repelled again by its weekly Cycle Top resistance at 1891.93, but closed above the upper trendline of its Bearish Wedge and weekly Short-term support at 1838.56.This appears to be the final point 5(b) of anOrthodox Broadening Top, often called a 5-point reversal pattern. The SPX currently has 7 points within its Megaphone pattern, a rare anomaly.A decline beneath the Bearish Wedge and Inrtermediate –term support at 1829.12 is an important step in reversing the trend. Long-term support at 1730.50 is the next level of support and the likely target once the upper supports are broken.
ZeroHedg: We started the week exuberant wearing the cleanest dirty shirt scoffing at the weakness of 'foreign' markets. By the end of the week, the Dow has dropped 5 days in a row in a week for the first time since May 2012 and the Nasdaq had its worst week in 9 months. The S&P dropped back into the red for 2014 - despite a late-day ramp effort - tracking AUDJPY all day long once again (and financials also red for 2014).
NDX reversed from the top trendlines two bearish formations.
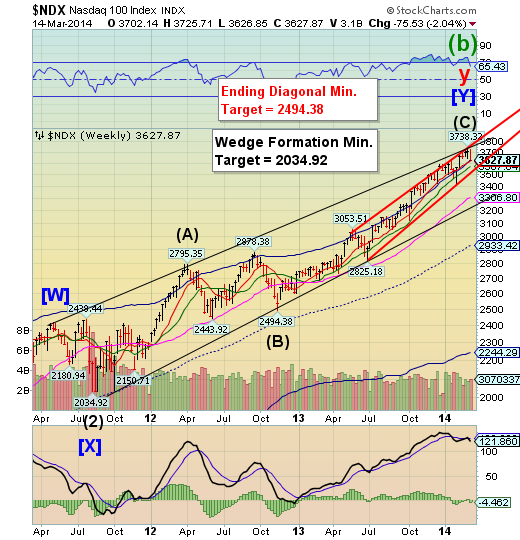
NDX was repelled by its bearish Wedge and Ending Diagonal formations and ended the week above its Cycle Top at 3622.54 and Short-Term Support at 3618.93. Breaking the cluster of supports that it has been above since October indicates that the two-year, seven-month rally may be coming to an end.
CNNMoney: Stocks closed lower on Friday due to more worries about the political climate in the Ukraine.The Dow, the S&P 500 and the Nasdaq were all down about 2% this week. Most of the losses came on Thursday.It seems that a sense of unease is returning to Wall Street lately. The VIX (VIX), a key gauge of volatility, was up 9% Friday and has surged 25% this week. And, CNNMoney's Fear and Greed Index, which looks at the VIX and six other indicators of market sentiment, has plunged into Fear mode. It was showing signs of Extreme Greed just a week ago.
Investors are bracing for Sunday's referendum in Crimea, where voters will decide whether to break away from Ukraine and join Russia.
The Euro“throws over” its Ending Diagonal.
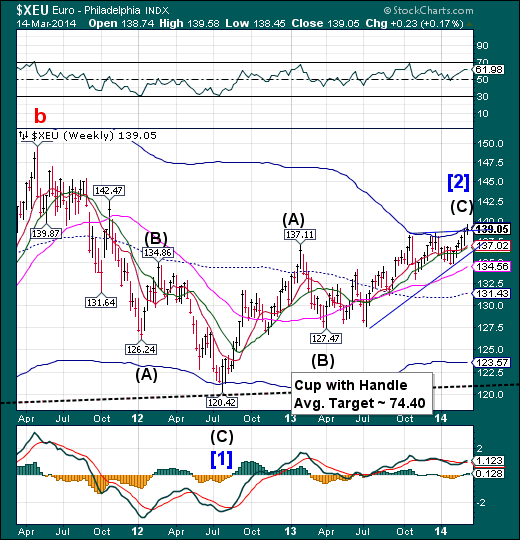
The Euro threw over its Ending Diagonal formation, but stayed beneath its weekly Cycle Top at 139.29 on Friday. Often investors see a “throw-over” as a new breakout, indicating more gains to come. Ending Diagonals often have throw-overs in the final week or two prior to a reversal.
Bloomberg: European Central Bank President Mario Draghi is taking aim at the euro.
In his strongest words yet on the currency’s advance to its highest level since 2011, Draghi said yesterday in Vienna that the exchange rate is “increasingly relevant in our assessment of price stability.” He suggested his eight-month-old policy of hinting at future interest ratesmay address the appreciation that may be holding back growth.
EuroStoxx lose two levels of support.
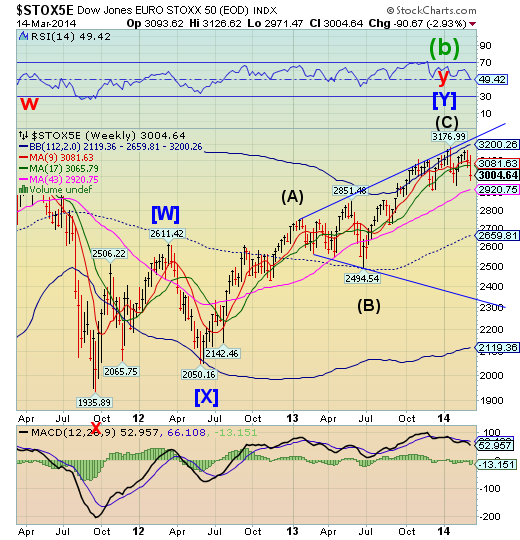
The EuroStoxx 50 index fell beneath weekly Short-term and Intermediate-term support, losing nearly 3% this week. EuroStoxx leads its currency counterpart, the Euro. It suggests that, if the EuroStoxx loses its support, then the Euro will follow.
Bloomberg: A walk through Moscow reveals the threats to Western companies of Iran-style sanctions on Russia: Renault cars fill the streets, Zara and Louis Vuitton (MC) shops pull in consumers and Carlsberg A/S brews the beer of choice.
Now foreign companies face the prospect of untangling from a country that’s become a key trading partner with close financial ties to the West, as U.S. President Barack Obama and German Chancellor Angela Merkel threaten economic retaliation for Russia’s moves to annex the Crimean peninsula. Local residents will vote tomorrow on whether to renegotiate the autonomous region’s status within Ukraine or join Russia.
The Yen makes a final retracement bounce.
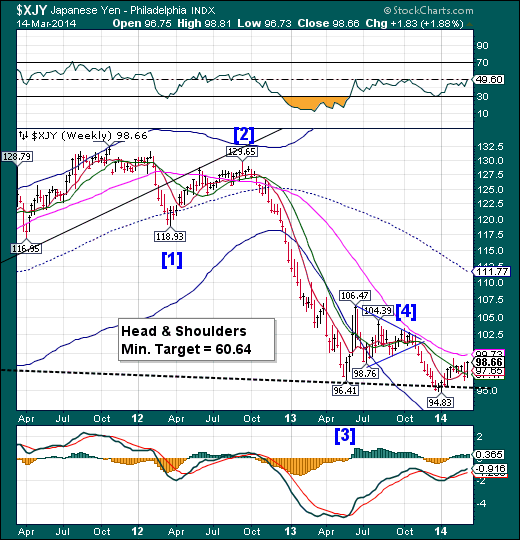
The Yen rose aboveweekly Intermediate-term and Short-term resistance at 97.65 that may challenge weekly Long-term resistance at 99.73 before making a reversal. However, a further decline is anticipated by the Cycles Model thus far. The next break of the Head & Shoulders neckline may bring the Yen beneath its 2008 lows.
Reuters: Growing tension between the West and Russia ahead of Ukraine's weekend referendum in Crimea pushed down stockson major world markets on Friday and drove up buying of safe-haven gold and the yen.
Financial markets watched nervously as the West increasingly talked about sanctions and Russia hit back with promises of retaliatory measures and displays of military prowess. The vote being held on Sunday by pro-Moscow authorities is to determine if Crimea will join Russia.
The Nikkeiis approaching its Head & Shoulders neckline.
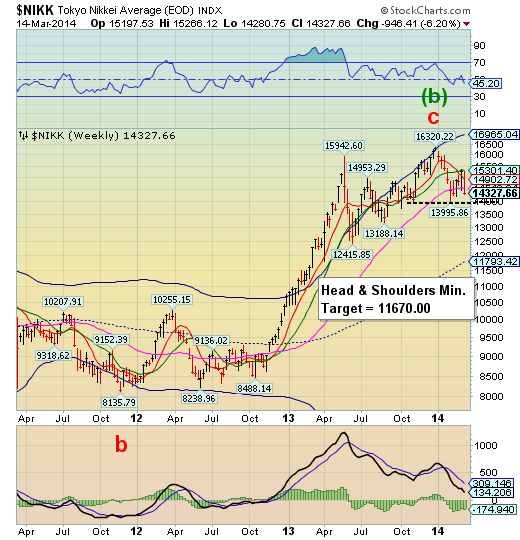
The Nikkei appears poised to break the neckline of its Head & Shoulders formation at 13995.86. Once the neckline is broken, the Nikkei may drop below its weekly mid-Cycle support at 11793.42. The Cycles Model projects a decline into early April.
Reuters: Japanese stocks skidded 2.7percent to a one-month low on Friday morning as concerns overUkraine and slowing growth in China rattled investors,underpinning the safe-haven yen and hurting exporters. The Nikkei share average fell 395.04 points to 14,420.94 in mid-morning trade after dropping to a low of 14,408.62 earlier,the weakest since Feb. 17.
"Investors are unwinding their long positions in the Nikkeiand short positions in the yen," said KyoyaOkazawa, head ofglobal equities and commodity derivatives at BNP Paribas.
"Short-term sellers like commodity trading advisors are also bigplayers today and they are also reacting to the falling copperprice."
U.S. Dollar extends its final Cycle low.
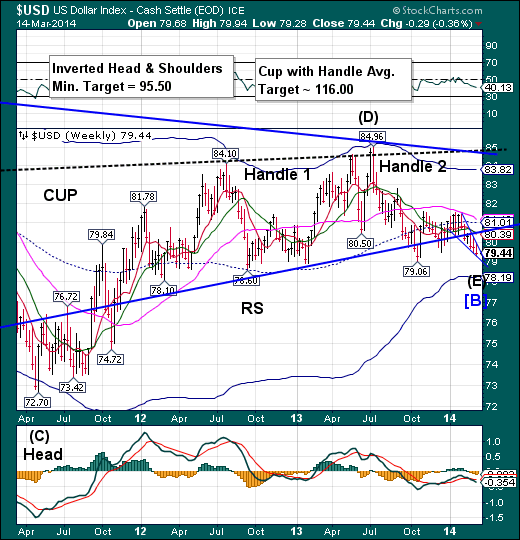
The dollar extended its Master Cycle low yet another week. It has not reversed above its Ending Diagonal formation yet, so it remains short-term bearish.A reversal above the trendline reinstates the bullish view on the Dollar.The dollar shorts may have to deal with the reversal in the coming weeks.
(CNBC) The Fed's custody holdings report is usually a sleeper, but this week there was a whopping withdrawal by some central bank. And while there's no evidence, speculation is that it was Russia.
Foreign central banks' holdings of U.S. marketable securities fell in the week that ended Wednesday by a record $106.1 billion, and that was mostly Treasurys. The holdings of U.S. securities held by the Fed for other central banks fell to $3.21 billion, the lowest level since December 2012.
Treasuries rallied, but did not make a new high.
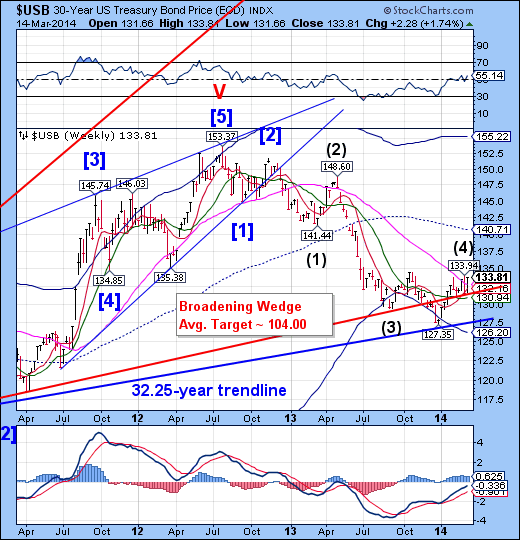
Treasuries rallied from the lower trendline of the Broadening Wedge at 131.50. The Cycle high made on March 3 remains intact.Should the March 3high remain, we may see a surprise collapse in bonds over the next month.
ZeroHedge: A month ago we reported that according to much delayed TIC data, China had just dumped the second-largest amount of US Treasurys in history. The problem, of course, with this data is that it is stale and very backward looking. For a much better, and up to date, indicator of what foreigners are doing with US Treasurys in near real time, the bond watchers keep track of a less known data series, called "Treasury Securities Held in Custody for Foreign Official and International Accounts" which as the name implies shows what foreigners are doing with their Treasury securities held in custody by the Fed on a weekly basis. So here it goes: in the just reported latest data, for the week ended March 12, Treasurys held in custody by the Fed dropped to $2.855 trillion: a drop of $104.5 billion. This was the biggest drop of Treasurys held by the Fed on record, i.e., foreigners were really busy selling.
Gold is completing a fifth wave.
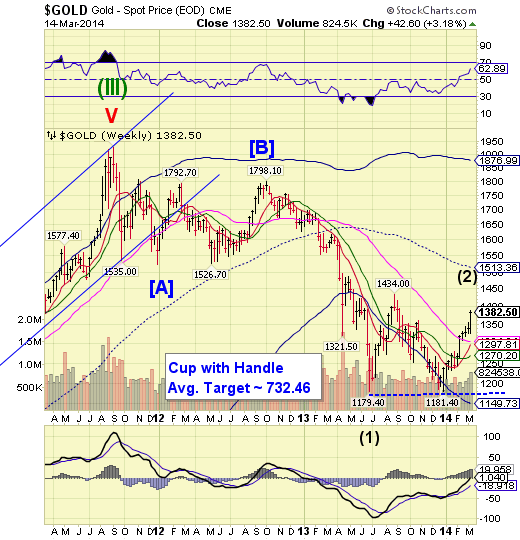
Gold may be nearing its peak retracement this weekend in an irregular Intermediate Wave (2).There is a possibility that it may probe 1400.00 on Monday before reversing. The Cycles Model calls for a month-long decline that may break through the Lip of a Cup with Handle formation. The potential consequences appear to be severe.
ZeroHedge: A curious story, and one which should be taken with a mine of salt, has surfaced out of the pro-Russian newspaper Iskra, which reports - so far on an entirely unsubstantiated basis - that last Friday, in a mysterious operation under the cover of night, Ukraine's gold reserves were promptly loaded onboard an unmarked plane, which subsequently took the gold to the US.
Crude declined beneath Long-term support.
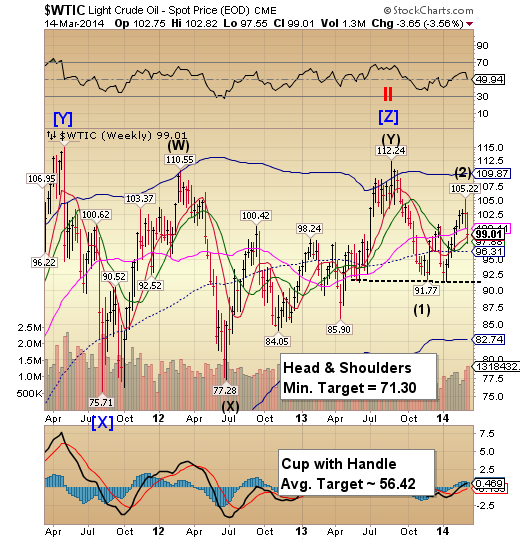
Crude dropped beneath Long-term support at 100.44 after making a bearish reversal candle in the previous week.The remainder of the supports lie between 98.86 and 96.31 in a very tight range that may be easily broken. There is a Head & Shoulders formation at the base of this rally may be overshadowed by the Cup with Handle formation, with an even deeper target.
ZeroHedge: Whether or not institutional investors, read large speculators, decided to invest alongside Putin in the one trade that is most critical to the future prosperity and positive cash flow balance of Russia, namely keeping the price of Crude high, and rising, is unknown, however, as the following chart the net position in crude oil futures as of the week of March 4, just hit an all time high of $44.0 billion up from $42.4 billion the week prior, surpassing all prior peaks, and certainly any set during the summer of 2008 when oil was threatening to make a run on $150, and was set to hit $200 if one believes Goldman (which nobody does).
China stocksbounced at a neckline.
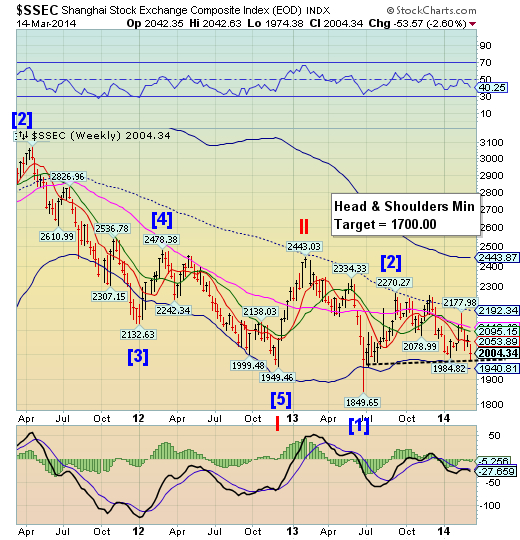
The Shanghai Index bounced at its Head & Shoulders neckline, portending a serious break ahead. While the Cycles Model calls for a brief bounce before it resumes the decline beneath the neckline, a sudden break of the neckline may void the bounce. There is no support beneath its Cycle Bottom at 1940.81.
ZeroHedge: In the aftermath in the recent surge in China's renminbi volatility which saw it plunge at the fastest pace in years, many, us included, suggested that the immediate next step in China's "fight with speculators" (not to mention the second biggest trade deficit in history), was for the PBOC to promptly widen the Yuan trading band, something it hasn't done since April 2012, with the stated objective of further liberalizing its monetary system and bringing the currency that much closer to being freely traded and market-set. Overnight it did just that, when it announced it would widen the Yuan's trading band against the dollar from 1% to 2%.
The Banking Indexdeclined beneath its trendline.
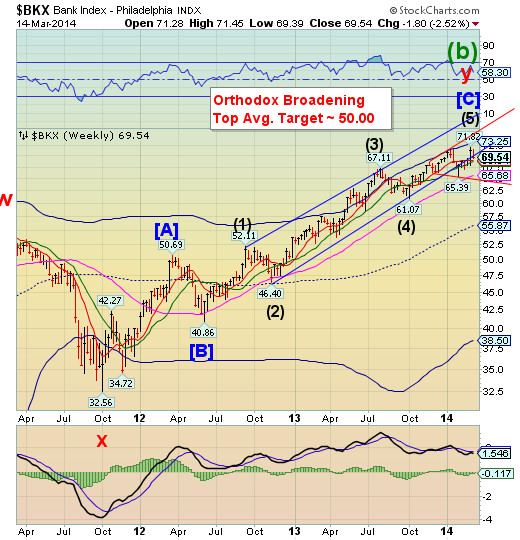
BKXbroke beneath its trading channel, but closed above its weekly Short-term resistanceat 68.94. This is the final probe higher in the Orthodox Broadening formation with bearish consequences.The Cycles Model suggests a new low may be seen by the end of March, which heightens the probability of a flash crash.
ZeroHedge: Everyone knows that after years of kicking the can and resolutely sticking its head in the sand, China is finally on the verge, if hasn't already crossed it, of a major credit event, confirmed by the first ever corporate bond default which took place a week ago. Few, however, know just why China is in this untenable position. If we had to select one data point with which to explain it all, it would be the following: just in the fourth quarter of 2013, Chinese bank assets rose from CNY147 trillion to CNY151.4 trillion, or, in dollar terms, an increase of almost exactly $1 trillion!
ZeroHedge: With the Bank of England recently denying any collusion with dealers to manipulate FX rates and exclaiming "it was not our job to go hunting for the rigging of markets," the WSJ reports that none other than that bastion of trust The Federal Reserve examined key FX benchmarks months before global regulators sounded alarms over the manipulations... but took no action.
ZeroHedge: The "good" news this evening is that Baoding TianweiBaobian Electric Co (TBE), the company which as recently as two days ago was rumored to be the second "imminent" Chinese corporate bond default which sent copper to multi year lows, has issued a statement that it will not default on its upcoming interest payment (due July 11th - so how the delisted company is convinced it will have enough cash four months from now is a mystery). The "bad" news is that markets don't care. There is a slight whiff of positivity in Copper futures but aside from that, weakness continues in China's corporate bond and stock market. Simply put, the market gets it - this is no longer about the next idiosyncratic bond (or trust) to default; this is about Xi's renewed confidence in efforts to 'clean up' the mounting local government and corporate debts and shrink the shadow-banking bubble. This is systemic, and the markets know it.
ZeroHedge: "While the sight of Russian flags, pro-Russian troops, and Russian navy ships in Crimea is now a day-to-day thing; this morning brings a new normal for the eastern Ukraine region - long lines at bank ATMs as the bank runs have begun. We noted last night the dreaded inversion of Ukraine's yield curve, the greater-than-50% yields on 3-month Ukraine government debt, and the pressures on local bank debt maturities as the ability to garner dollars cost-effectively was becoming a problem but on the heels of concerns by the head of the central bank that moving cash in Crimea was difficult, ATM withdrawal limits have been cut. People in long ATM lines are reported to be concerned because "banks are closing" but it is Deutsche Bank's comments this morning that raised many an eyebrow as they suggest thatUkraine's debt is pricing in a "burden-sharing" haircut for bondholders (which as we have seen in the past - in Cyprus - can quickly ripple up the capital structure and become a depositor haircut).
