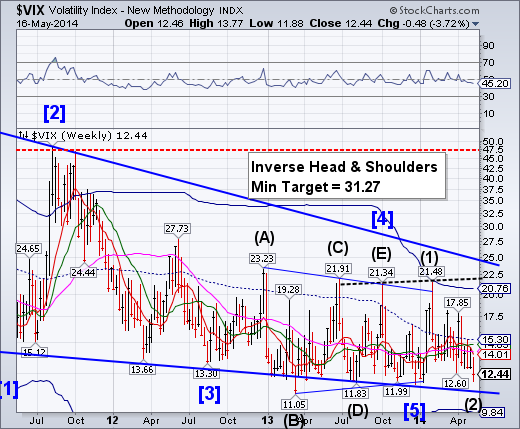
VIX made a deeper low on Monday, but not beneath than the December 26 low at 11.66.AnIntermediate Wave (2) low may have been putin.With no help from the yen Carry trade, slamming the VIX can help turn equities positive at the end of the day.
SPX may have made a reversal
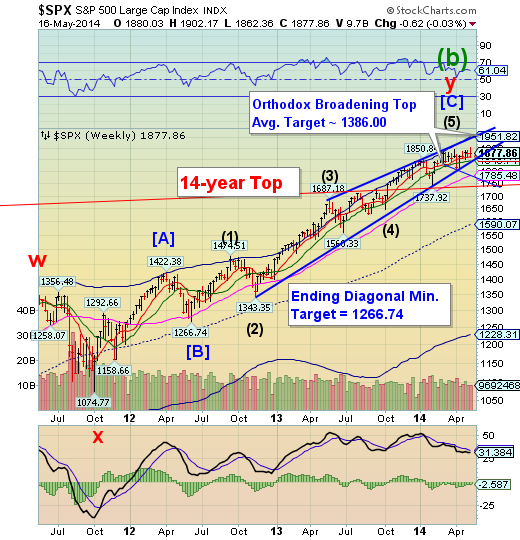
SPX probed higher on Monday to 1902.17, then made a reversalto challenge its Short-term support at 1863.41 on Thursday. It ended the week making a near 38.6% retracement of its decline.The lower Ending Diagonal trendline is at 1850.00, while Intermediate-term support is at 1845.00. Beneath it lies its 14-year Top trendline at 1740.00.
ZeroHedge: After April's confidence-inspiring reflexive rebound (thanks to hope for the future more than current perceptions) back near post-crisis highs, it seems the less-than-frigid-weather and record-er highs in stocks were not enough to maintain the status quo enhancing exuberance. UMich confidence dropped and missed expectations by the most since June 2006. Maybe its fears of El Nino? Maybe its concerns at the bond market signals? Or maybe - the reality is that the average joe is not as cock-a-hoop as the man-on-the-TV says he should be. Economic conditions dropped to their lowest since November. Higher highs in stocks and lower highs in confidence - not what the Fed wants.
NDX is still beneath its Wedge trendline
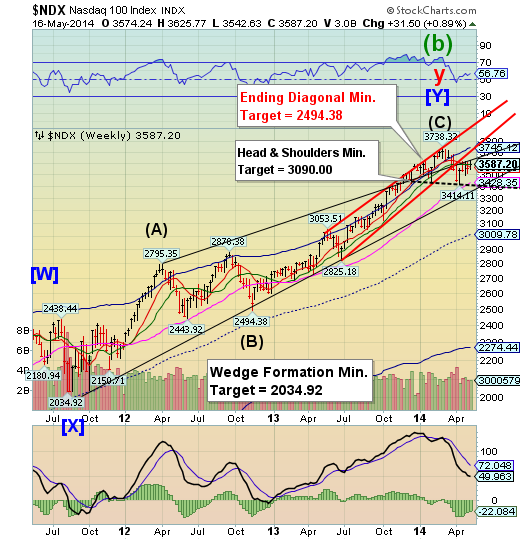
NDX was stopped again at the upper trendline of the Wedge formation Intermediate-term resistance at 3587.54. Short-term resistance made a bearish cross below Intermediate-term resistance, adding to the bearish profile of NDX.It now appears to be preparing to test the Head & Shoulders neckline at 3410.00.The equities made a Primary Cycle high on Tuesday. This raises the probability of a 6-week long decline in stocks.
ZeroHedge: When it comes to the current state of the market, everyone knows - whether they admit it or not - that it is broken. And we aren't talking HFT which while rigging price discovery, generally does so on a microburst momentum basis which at most lasts for the duration of the trading day. The real culprit of the broken market is the Fed, a Fed which as we have explained over the years, is simply seeking to compensate for the collapse in stock (and flow) from the unwind of shadow banking which was nearly crushed in the days after Lehman.
The euro continues its decline beneath critical supports
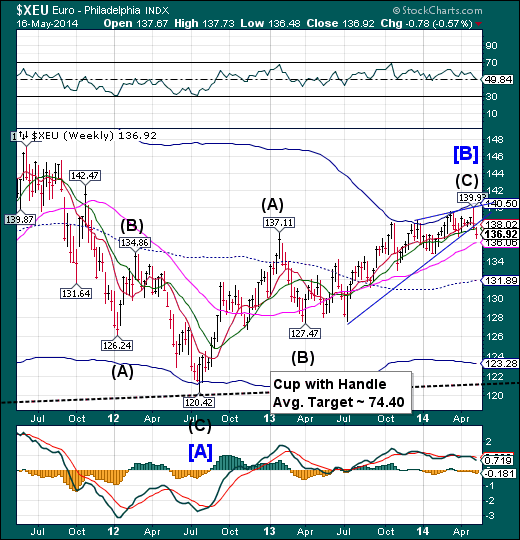
After making a monthly key reversal The euro continued its decline beneath its Ending Diagonaland critical supports.Ending Diagonals are usually fully retraced, so we may expect a minimal decline to 127.47, with a high probability of testing its weekly Cycle Bottom at 123.28.
WSJ: The euro-zone economy grew only slightly last quarter, suggesting that its convalescence from crisis remains troubled and putting added pressure on the European Central Bank to enact fresh stimulus measures.
Economic activity in the 18-country currency zone rose by 0.8%, in annualized terms, in the first three months of 2014 compared with the previous quarter—well below economists' expectations.
Excluding Germany, which grew at an annualized 3.3% pace, economies in the rest of the bloc even contracted a bit, data released Thursday showed.
EuroStoxx lingers near the top, but no new highs
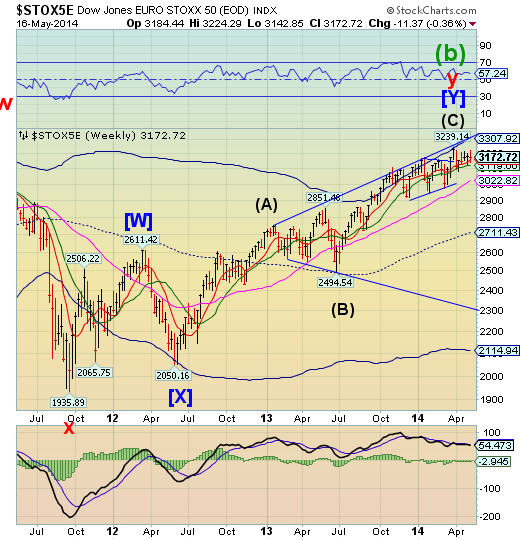
The EUROSTOXX index has made multiple attempts to challenge its high at 3239.14.Thursday’s attempt at a new high was the latest, which quickly reversed back down. Could this be the failure that finally breaks supports next week?
ZeroHedge: In November we showed a chart showing the yawning chasm of exuberant faith-in-Draghi hope that was 2013-to-2014 earnings growth expectations in Europe. At the time we remarked - now prophetically - how it would seem Draghi's "whatever it takes" confidence-inspiring orgy of European asset-buying had driven the EUR almost 20% higher from the 2012 crisis lows... and in the meantime had crushed European competitiveness. The hockey-stock hope at the end of 2013 has not materialized - surprise - in fact earnings growth expectations have utterly collapsed in the last 2 months... time for a "whatever it takes" to weaken the EUR jawboning soon (all without the aid of a fallacious and Treaty-busting OMT).
The yen may be preparing to break out
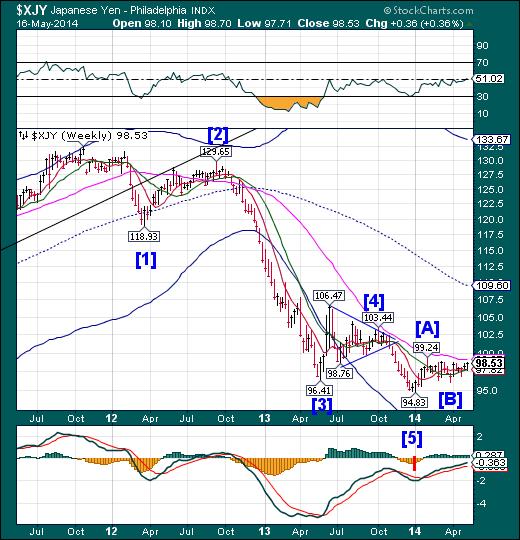
The yen has remained above its Model supports and appears to be creeping higher toward its Long-term resistance at 99.07. This may resolve the three-month-long sideways consolidation, which is a coiling action that often results in a continuation of the move preceding it. Should traders start to view the yen as a safe haven during political and economic turmoil, the money flow may reverse course and move from stocks to currencies like the yen.
DanielsTrading: The Japanese yen was hurtling toward a second-straight week of gains against the world’s reserve currency on Friday as the monetary unit’s value as an asset haven gained amid increasing concerns for the globe’s largest, most powerful economic systems, according to Bloomberg.
The U.S. economy, respected as the world’s largest, is in need of continued stimulus to make it healthier, Janet Yellen, chair of the U.S. Federal Reserve told an audience during a Thursday eve speaking engagement. The economy of China, checking in at the globe’s second largest, is navigating rough economic times. Japan’s economy, which is based on the export of electronic devices and automobiles, is the globe’s third largest.
The Nikkei tested its Head & Shoulders neckline
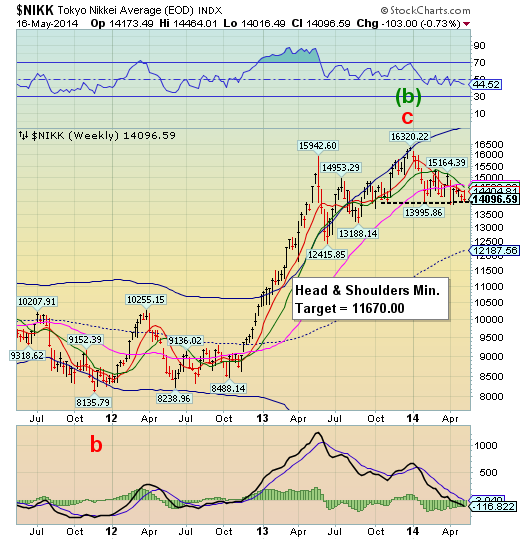
The Nikkei 225 closed near the neckline of its Head & Shoulders formation at 14000.00 on this week.Lower highs and lower lows are an indication that liquidity is exiting the markets. A breakout in the yen may accompany the Nikkei losing neckline support.
Reuters: Asian shares came under pressure on Friday, with Japanese stocks skidding as the yen rose against the dollar, which has struggled in recent days as U.S. Treasury yields fell.
A second day of losses on Wall Street pulled MSCI's broadest index of Asia-Pacific shares outside Japan down 0.1 percent. The index has gained about 2 percent on the week during which Wall Street climbed to record highs.
Tokyo's Nikkei stock average dropped 1.9 percent, dragged lower by the yen's gains against the dollar, which could put pressure on the earnings of Japanese exporters. The Nikkei has shed 1 percent this week.
U.S. dollar rises above Short-term support, challenges the Wedge trendline
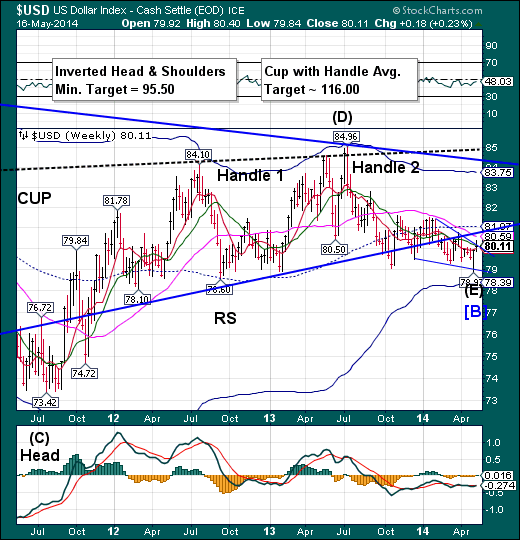
The Dollar rose above Short-term support at 80.01 and challenged its trendline and Intermediate-term resistance at the close of the week. A clear rally above Intermediate-term resistance at 80.19 and the Wedge formation may be noteworthy to traders.The significance of this reversal may be its impact on all the other asset classes.A challenge of, or a breakout above, mid-Cycle resistance at 81.07 cyclically confirms a probable new uptrend.
Reuters: The dollar held a slim gain against a basket of major currencies on Friday as benchmark U.S. Treasury yields edged up from their lowest levels in six months, although the greenback faces further weakness if yields resume their decline.
The dollar pared earlier modest losses against the Japanese yen and euro after a stronger-than-expected report on U.S. housing construction.
"Falling yields have been problematic for the dollar," said Richard Franulovich, senior currency strategist at Westpac Banking Corp in New York. "Bond yields look too low here against this economic backdrop."
Treasuries extended their rally
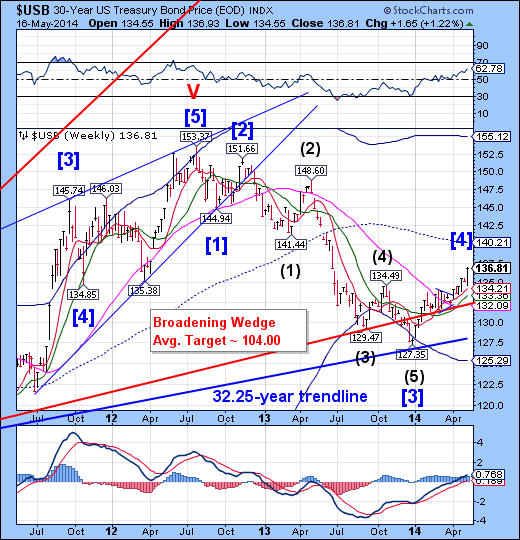
The Long bond has confounded the shorts with its extended (cycle inversion) rally. It may be complete, or nearly so, since the Cycle Turn window is upon us.USB has a date with a major Cycle bottom near the end of May.The rally may be a bull trap for the unaware.
WSJ: Investors cashed out some chips Friday from the Treasury bond market, but bond prices still posted the biggest weekly rally in more than a month.
Demand for safe-haven bonds pulled back on a 13.2% rise in housing starts, sending the yield on the benchmark 10-year note higher from a six-month low. Keeping selling in check was a separate report showing consumer confidence declined in mid-May.
Gold challenges, but cannot overcome resistance
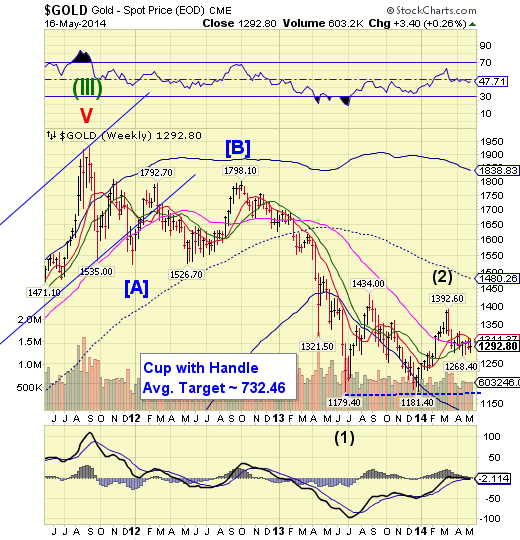
Gold’s challenged Long-term resistance at 1301.80, but it could not hold that as support.Despite last week’s key reversal, gold closed marginally higher this week. It appears that the decline may resume again early next week, with much deeper lows.
FoxBusiness: Gold struggled below $1,300 an ounce on Friday, as data indicating brighter prospects for the U.S. economy reinforced the view that the Federal Reserve will maintain its pace of stimulus tapering.
Platinum was headed for its biggest weekly gain in three months on supply worries due to prolonged strikes in top producer South Africa, while palladium was poised for a weekly increase of around 1 percent.
Spot gold eased 0.1 percent to $1,294.41 an ounce by 1454 GMT, while U.S. gold futures rose 0.1 percent to $1,294.60 an ounce.
Crude makes a Fibonacci retracement
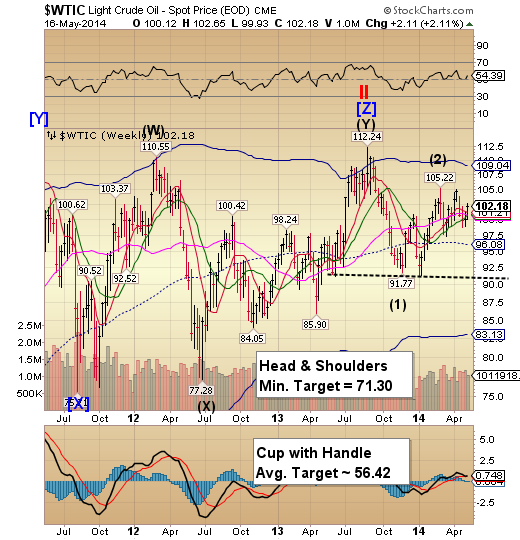
Crude Oil rallied above Model supports to make a 62.6% retracement of its prior decline.Thursday’s high was an inverted Trading cycle, which indicates a potential decline over the next four weeks.Monday may bring a change of trend to WTIC.
MarketWatch: Oil futures climbed Friday to tally a gain of 2% for the week as a jump in April U.S. housing starts and the coming summer-driving season raised expectations for energy demand.
Crude oil for June delivery CLM4 +0.67% rose 52 cents, or 0.5%, to settle at $102.02 a barrel on the New York Mercantile Exchange. Prices ended last week at $99.99.
U.S. crude oil continues to get some support from better gasoline demand and a bit lower refinery throughputs due to repairs at some [big refineries] down along the Gulf Coast,” said Richard Hastings, macro strategist at Global Hunter Securities.
“Throw in some U.S. dollar wobbles and some U.S. inflation hopes and then you get more support, once again, above $99 per barrel,” he said.
China stocks repelled by resistance
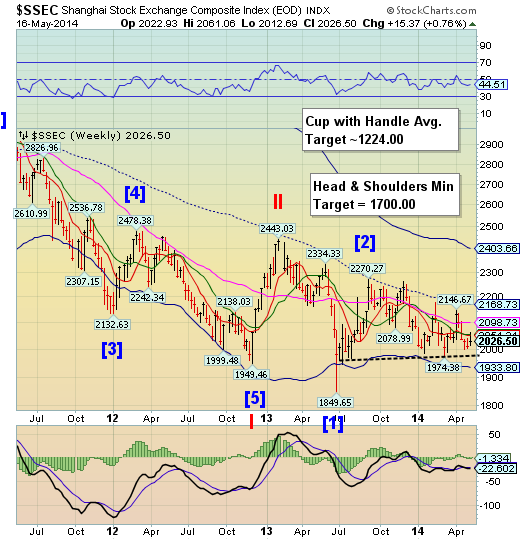
The Shanghai Index retested it weekly Intermediate-term resistance at 2055.41 and was repelled. It resumed its descenttoward the neckline of its Head & Shoulders formation. Last week I had been looking for a Trading Cycle low. Instead, a Primary Cycle had been dominant, allowing the Trading Cycle to make a high on /Tuesday, instead.This will now allow the Primary Cycle (a stronger cycle) to complete by declining through the Head & Shoulders neckline. There is no support beneath its Cycle Bottom at 1938.09.
ZeroHedge: Just last month we highlighted how the collapse in China's shadow-banking system, it's concomitant credit crunch, and vicious circle of commodity-financed credit creation could spread contagiously to the rest of the world -through refusal to pay. It seems we were prophetic as Reuters confirms thatmoney owed to Chinese firms by their customers has reached a record high. As China's economy continues to cool, companies are waiting longer and finding it harder to get paid for goods and services they've already sold, leading to record amounts of receivables - and potential write-offs - on corporate balance sheets. As one Chinese business owner exclaimed: "If you don't pay me and I pay others, aren't I just a sucker? I'm not that stupid."
The Banking Index breaks Long-term support
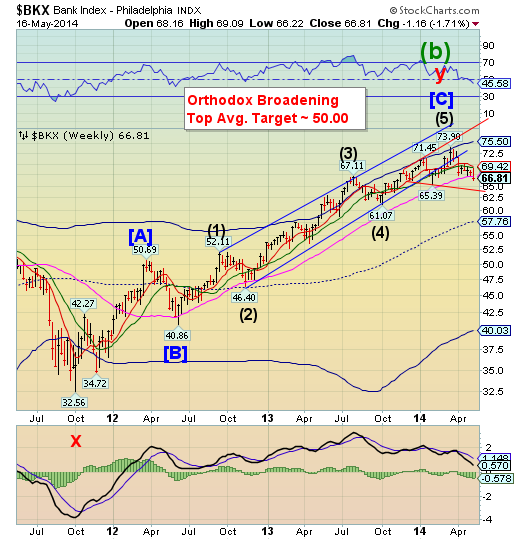
BKX has broken throughLong-term support at 67.19 this week and appears to be completing its Orthodox Broadening Top formation by breaking the bottom trendline. The next target is below its Orthodox Broadening formation near 62.50.A bounce from beneath the Broadening Top may heighten the probability of a flash crash soon after.
ZeroHedge: Deutsche Bank, which most recently has been in the spotlight for hightailing it out of the silver and gold fix (because it is clearly innocent of any precious metals manipulation as an "independent, impartial and extensive" inquiry by the Bank of England will surely prove), has a message for its traders: don't swear. Also don't boast or cheat.
ZeroHedge: Who can possibly forget the following exchange from April 2013 in which a very simple question was asked: so simple that apparently nobody else in the very serious media had ever even considered it.
Scott Solano, DPA: MrDraghi, I've got a couple of questionfrom the viewers at Zero Hedge, and one of them goes like this: say the situation in Greece or Spain deteriorates even further, and they want to or are forced to step out of the Eurozone, is there a plan in place so that the markets don't basically collapse? Is there some kind of structural system, structural safety net, especially in the area of derivatives? And the second questions is: you spoke earlier about the Emergency Liquidity Assistance, and what would have happened to the ELA in Cyprus, the approximately €10 billion, if the country had decided to leave the Eurozone?
(NYTimes: Two large international banks — Credit Suisse and BNP Paribas — are expected to plead guilty to criminal charges within the next few weeks. If that happens, they will pay large fines and officially be felons.
Should anyone care?Is there really a difference between criminal convictions of banks and civil settlements that yield equally large fines?
Attorney General Eric H. Holder Jr. certainly thinks so. He proudly proclaimed a couple of weeks ago that there was no bank “too big to jail.”
The obvious problem with that statement is that it is a non sequitur. Big or small, banks and other corporations are too inanimate to jail. Executives conceivably could be sent to prison, but that is not what we are talking about here.
ZeroHedge: Just in case you were not convinced what a fragile fallacious lie the entire world's status quo has become, the Bank of Japan just provided one more straw on the camel's back of faith-based investing. As Bloomberg reports, BoJ officials are concerned that cooler-than-normal weather triggered by El Nino this summer will curb spending and weigh on an economic rebound.
Disclaimer: Nothing in this email should be construed as a personal recommendation to buy, hold or sell short any security. The Practical Investor, LLC (TPI) may provide a status report of certain indexes or their proxies using a proprietary model. At no time shall a reader be justified in inferring that personal investment advice is intended. Investing carries certain risks of losses and leveraged products and futures may be especially volatile. Information provided by TPI is expressed in good faith, but is not guaranteed. A perfect market service does not exist. Long-term success in the market demands recognition that error and uncertainty are a part of any effort to assess the probable outcome of any given investment. Please consult your financial advisor to explain all risks before making any investment decision. It is not possible to invest in any index.
