

-- VIX made a new weekly low, but did not retest the lower trendline of its Ending Diagonal as it put in an early trading cycle low on Monday.The ensuing rally may be surprisingly sharp and strong as it takes out overhead resistance..
SPX extends its top.

SPX made its final high on Tuesday, extending the Cyclical Bull Market by another week.Round number resistance at 2000.00 played a key role in this week’s action, as SPX went above then dipped below, finally closing above 2000 in the final hour on Friday. It is noteworthy to observe how extended the final Wave (5) is, making 445 points in 14months. The combined Waves (1) through (3) are 420 points. Extraordinary.
(ZeroHedge) For the 6th week of the last 8, Treasury yields declined with 30Y pressing to 3.05% (and 10Y 2.32%) handles to 15-month lows. US equity markets saw volume crater as the early high-stops were run in the EU session and low-stops run in the US session before the ubiquitous EU close ramp lifted futures to VWAP and S&P cash to 2000.xx where it stayed for the rest of the day in a wholly unrigged way. Trannies ended the week red and Russell the best.
NDX continues to challenge its Ending Diagonal trendline.

NDX continues challenging the upper trendline of its Ending Diagonal. The wave structure appears complete, or nearly so.That may be the final high, since NDX has a date with a significant cycle bottom low at the end of October.
(ZeroHedge) As they say in England, we appear to be getting to the vinegar strokes of the Fed's buying efforts. As expected, the NYFed announced its Permanent Open Market Operations (POMO) schedule for September which covers just 11 days (including no Fridays at all) summing to a mere $15bn of Treasuries planned to be purchased... (with only 5 days in size).
The Euro declines beneath mid-Cycle support.

As the Euro accelerates its decline through mid-Cycle support at 132.79, a likely target may be the origin of its Ending Diagonal formation at 127.55, where it may find support early next week.The bounce may be short-lived, with overhead resistance at mid-Cycle resistance.Should that occur, a bounce at that level may create a new Head & Shoulders neckline with a still lower target.
(WSJ) Europe's struggle to prevent ultralow inflation from discouraging business investment and undermining the continent's fragile economy deepened as consumer prices dropped in August to a five-year low.
The data released Friday keeps pressure on the European Central Bank to take more dramatic stimulus measures to boost demand and inflation, and comes just days after ECBPresident Mario Draghi warned of the risks of investors' falling expectations for consumer-price growth. His remarks were seen as suggesting the ECB is moving closer to large-scale purchases of public and private debt, known as quantitative easing, at a time when the U.S. Federal Reserve is nearing an end of its stimulus program.
Euro Stoxx repelled at Long-term resistance.

The EuroStoxx 50 index saw its retracement stall at Intermediate-term resistance at 1380.16 after attempting to probe higher.There is a potential Head & Shoulders neckline at 2977.52.00 that, if Stoxx drops beneath, may trigger a decline to its target at 2629.59. The Broadening formation anticipates a much deeper target, where the Cycle Bottom at 2293.81 is pierced. In addition, the Cycle Model suggests no potential relief bounce until early October.
(MarketWatch) — European stock markets ended slightly higher on Friday, after having trimmed earlier gains as investors speculated whether lackluster euro-zone inflation data were weak enough to trigger more easing from the European Central Bank.
The data: Consumer prices in the currency union grew by a meager 0.3% in August, as expected. That was down from 0.4% in July and marked the lowest level in almost five years. While the reading initially adds more pressure on the ECB to launch new stimulus measures at its meeting next week, economists are divided in their view about the actual decision.
The yen completes the Triangle at a Cycle low.

The Yen appears to have made its Master Cycle low on August 22, as anticipated. The reversal may change the liquidity flows, since this would have the effect of drying up the Yen carry trade which has been a major source of funding for the equities markets.
(WSJ) The yen rose against the dollar, euro and British pound on Thursday after an escalation of the conflict between Ukraine and Russia sent investors scurrying into haven assets.
The dollar fell 0.2% versus the yen to ¥103.66, while the euro dropped 0.3% to ¥136.67. The pound slid 0.2% to ¥172.
Investors moved into the Japanese currency, U.S. Treasurys and gold after Ukraine accused Russia of invading the country, renewing concerns that the conflict could destabilize Eastern Europe. The worries about the stepped-up hostilities overrode the positive effect of strong U.S. economic growth for the dollar.
The Nikkei has made a reversal pattern.

The Nikkei made its secondary high on August 22 while the Yen made its low.A failure to reach new highs last week may result in a spectacular sell-off. The next possible low may occur in early September in a rare Panic Cycle decline.
(Bloomberg) The world’s biggest retirement fund swung to an investment gain last quarter as Japanese stocks rebounded, after posting its first loss since 2012 in the previous three months.
Japan’s Government Pension Investment Fund made a 1.8 percent return in the quarter ended June as its assets swelled to 127.3 trillion yen ($1.2 trillion), after a 0.8 percent loss in the three months through March. Domestic shares returned 5.1 percent and accounted for 17.3 percent of investments, up from 16.5 percent at the end of March. Japanese debt made up 53.4 percent of the fund’s assets, the smallest proportion ever and a 2 percentage-point drop from the previous quarter. The amount of money invested in foreign bonds and stocks rose to records.
US Dollar stalls at a new resistance level.
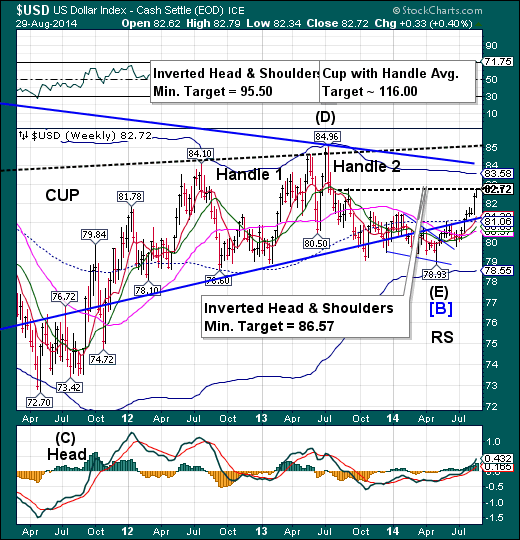
The US Dollar has stalled at the next resistance level, creating a potential new Head & Shoulders neckline that may ultimately enable the USD to overcome its higher Head & Shoulders trendline and break out above its 2013 high at 84.96.However, there is a doubly indicated Cycle target date of September 5, which potentially allows the dollar to retrace back to its mid-Cycle support and trendline at 81.06.
(Reuters) - Speculators raised their bullish bets on the U.S. dollar for a second week to their highest in more than two years, according to data from the Commodity Futures Trading Commission released on Friday.
The value of the dollar's net long position soared to $32.92 billion in the week ended Aug. 26, compared with $30.40 billion the previous week which was the highest net long in the U.S. dollar since June 2012.
To be long a currency is to take a view it will rise, while being short is a bet its value will decline.
USB may have made its final high.

The Long Bond made the high that was anticipated in last week’s newsletter. Chances are now better-than even of an abrupt decline that may last through mid-September.The potential target may be weekly Cycle Bottom support at 125.02.
(WSJ) Government-bond yields touched new lows in the U.S. and Germany, as investors piled anew into ultrasafe debt amid growing concern about the pace of European growth.
The gains underscore the dynamics that have made government bonds a surprise star performer this year—a winning streak many analysts now expect will continue.
When 2014 started, many Wall Street strategists predicted interest rates would rise, sending bond prices lower, as the U.S. economy picked up speed and the Federal Reserve reduced its monthly stimulus, due to end in October.
Gold consolidates beneath resistance.

Goldconsolidated this week as it retested Model resistance at 1296.88.It is now capable of a panic decline to or through the Lip of its Cup with Handle formation at 1181.40.The Cycle low was made on August 22. The consolidation may now be over and a new decline underway.
(Forbes) Survey participants in the weekly Kitco News Gold Survey are split over their views on gold, with no one group capturing the majority but a nominal number lean bullish.
Out of 37 participants, 22 responded this week. Of those, nine see higher prices, six see lower prices and seven see prices trading sideways or are neutral. Market participants include bullion dealers, investment banks, futures traders and technical-chart analysts.
Last week, survey participants were bearish. As of 11:30 a.m. EDT, Comex December gold was up about $8 for the week.
Crude retests its Head & Shoulders trendline.

Crude bounced back to its Head & Shoulder trendline at 95.84 this week.It now appears ready to decline to a major Cycle bottom in mid-September.Despite rising global tensions, crude is not reacting as most people would think.
(AL) A tanker loaded with $100 million of crude oil has disappeared from satellite tracking while anchored in the Gulf of Mexico.
The tanker, last seen Thursday on satellite images about 60 miles off the coast of Texas, has since disappeared off the tracking system used by the Coast Guard, Reuters is reporting. The United Kalavrvta cargo ship has been the center of a long legal battle between Iraq's government and Kurdish leaders over who owns its oil.
Iraqi leaders had filed a lawsuit in America demanding that U.S. Marshals seize the oil when it reaches the Texas port city. The Kurdish Regional Government disputes the claim.
China rolls over from a Trading Cycle high.

The Shanghai Indexrolled over from a Trading cycle high made August 20.The decline is due to hit a low by mid-September. It could be a doozy since Primary Cycles are known for their drama.
(ZeroHedge) Unlike the QE-lite-driven exuberance in Chinese stocks of the last few weeks (which faded dramatically overnight), China's industrial commodities (with near-record inventories) and seeing prices collapse. This may shock some who espy PMIs and government-created trade data and proclaim, China is fixed. In fact, as JPMorgan's China Sentiment Index (JSI) shows, things are anything but bright as it fell to the lowest since June last year (at 48.3 in August). Sales and margins are tumbling - despite supposedly lower input costs. Lastly, those focused on spot Yuan movements (strength in recent weeks) have suggested this also confirms China strength - inflows - but looking out 12-months shows the market is expecting a dramatic devaluation from current levels in the Chinese currency is coming.
The Banking Indexextends its retracement.

--KBW Bank extended its rally above weekly Short-term support at 69.It is due for a Panic Cycle low within the next two weeks.A further decline to mid-Cycle support at 61.04 may complete its Orthodox Broadening Top formation, sending it near its Cycle Bottom support at 44.27.
(ZeroHedge) Based on the unprecedented collapse in trading volumes of cash products over the past 6 years, one thing has become clear: retail, and increasingly, institutional investors and traders are gone, probably for ever and certainly until the Fed's market-distorting central planning ends. However, one entity appears to have taken the place of conventional equity traders: central banks.
Courtesy of an observation by Nanex's Eric Hunsader, we now know, with certainty and beyond merely speculation by tinfoil fringe blogs, that central banks around the world trade (and by "trade" we meanbuy) S&P 500 futures such as the E-mini, in both futures and option form, as well as full size, and micro versions, in addition to the well-known central bank trading in Interest Rates, TSY and FX products.
(ZeroHedge) It's been 6 years since Lehman went bankrupt overnight, stunning bondholders who were forced to reprice Lehman bonds from 80 to 8 (see chart below) in a millisecond, and launching the world's worst depression since the 1930s, which courtesy of some $10 trillion in central bank liquidity injections, has been split up into several more palatable for public consumptions "recessions", of which Europe is about to succumb to the third consecutive one even if for the time being the Fed's has succeeded in if not breaking the business cycle, then certainly delaying the inevitable onset of the next major contraction in the US economy.
Paradoxically, instead of taking advantage of this lull in volatility and relative economic calm, and making the financial system more stable, all so-called regulation has done, is paid lip service to the underlying problems, hoping that should the next crisis appear the Fed will be able to delay it yet again by throwing countless amounts of taxpayer money at the problem. In the meantime, the biggest banks have gotten so big that the failure of one JPM or Deutsche Bank, and their hundreds of trillions in gross notional derivatives, would lead to the biggest financial and economic catastrophe ever witnessed and make 2008 seem like a fond memory of economic euphoria.