

-- VIX closed at the upper trendline of its Ending Diagonal after testing weekly Cycle Top resistance at 18.42. It has also left an inverted Head & Shoulders formation that indicates a probable surprise target in the near term.
SPX had a larger breakdown this week.
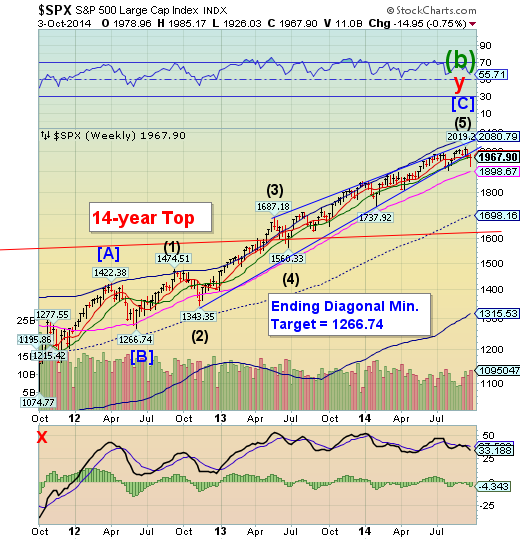
The breakdown in SPX is now much more obvious. So obvious that a great effort was made on Thursday and Friday to erase those losses before the end of the week. Unfortunately, as noted last week, Intermediate-term support at 1972.21 that held last week is now resistance. The next support beneath is the weekly Long-term suport at 1898.67. Once broken, SPX may fall to mid-Cycle support at 1698.16.
Technical analysis suggests that an Ending Diagonal may be completely retraced, once broken. Elliott Wave analysis suggests that an Intermediate Wave (1) decline may exceed its Intermediate Wave (4) low of the rally in a change of trend.
(ZeroHedge) Have the S&P 500 and Dow Jones Industrial Average seen their highs for the year? At this point in 2014, it’s probably a coin toss. There are several factors in favor of a further rally, to be sure. Corporate profits are still robust, revenue expectations are modest, and long term interest rates remain equity-friendly. On the flip side of the U.S. equity market coin: long term valuations are toppy, plenty of other markets (commodities, bonds) seem to signal an impending global recession, and a host of geopolitical concerns now seem to be hitting a full boil. Also, let’s not forget that the Russell 2000 peaked in, oh, March (1209) and July (1208) and is down 8.8% from that last high. By that measure, equities are already rolling over. It is true that markets climb a wall of worry. Until it falls on them.
NDX loses Short-term support, bounces at Intermediate-term support.

NDX declined through its Short-term support at 4039.02, challenging Intermediate-term support at 3963.89, but rallied back to close beneath Short-term support-turned-resistance. The weekly chart does not contain the granularity of a daily, so we may be missing some details that our subscribers have. Suffice it to say that lower supports may be broken soon, as well.
(ZeroHedge) Despite a low-volume melt-up in stocks off yesterday's European close lows, US equities closed lower on the week with small caps once again the laggards. Even as stocks closed red, the costs of protection in credit and equity markets tumbled as the last 2 days volumeless liftathon in stocks took place against the background of very modest Treasury selling - this has the stench of high-yield bond exposure being significantly reduced (and synthetic hedges being lifted) - something we saw Wednesday into the close.
High Yield challenges critical support.

The High Yield Index broke beneath bot the Ending Diagonal trendline and its Broadening Top formation. A retracement bounce could not regain the lost ground at Intermediate support/resistance at 142.28. A drop beneath the Ending diagonal trendline next week may trigger a cascading decline. This is also suggested by the Orthodox Broadening Top formation nearing completion.
(ZeroHedge) Junk bond investors suffered their biggest quarterly loss since 2011, losing 1.7% in Q3 pushing yields up to one-year highs (despite Treasury yield compression). Managers, knowing full well the underlying liquidity to handle any further selling is not there are out en masse explaining that "high-yield should bounce back in the fourth quarter," relying on the fact that 'historical' defaults are still low and the economy is recovering (as if that's not priced in already). The worst hit segment of the junk market is CCCs and below - at 22-month lows - as Bernanke and Yellen forced investors ever further along the risk spectrum for yield. Of course, equity markets (Russell 2000 aside) have ignored much of this decline until recently, but the plunge in leveraged loan issuance suggests all that cheap-buy-back-funding is rapidly disappearing (even for the best credits and biggest names).
The Euro is now beneath its Cycle Bottom .

The Euro declined through its Cycle Bottom support at 125.87 and appears ready to bounce from a Trading Cycle low early next week. The question still remains, will the Cycle Bottom at 125.87 give enough support for a bounce, or wil it decline to the Lip of a Cup with Handle formation at 122.00 sometime next week?
EURO STOXX (FSTX) has broken through its weekly supports.

The EuroStoxx 50 Index fell through all of its supports this week, leaving the way open for a potential 700 point drop next week. The Broadening Top formation, which anticipates a much deeper target, may be pierced next week as EuroStoxx gain momentum to the downside. In addition, the Cycle Model suggests no potential relief bounce until late October.
(ZeroHedge) Broad European stocks plunged into the red for 2014 today as a rattled Mario Draghi disappointed a hungry-for-more risk market. Bloomberg's BE500 index dropped its most since June 2013 to 2-month lows led by weakness in Italian banks. UK stocks underperformed (-3.6%) but Spain, Italy, and Portugal all tumbled 2-3%. The selling pressure interestingly stayed in stocks as bond spreads rose only modestly and EURUSD roundtripped to only a small rise from pre-ECB. Notably, US equities are cratering as they are so used to the pre-EU-close pump that did not happen.
The Yen meets time, but not distance targets.

The Yen is in overtime for its Master Cycle low. Apparently, it has not met its downside target of 90.35 and may continue until finished at that level. The next probable turn day is early next week, so a sharp reversal is expected. This will have the effect of drying up the Yen carry trade which has been a major source of funding for the equities markets.
(Bloomberg) The Japanese yen goes into freefall. China’s fragile economy tips over the edge. A wave of profit-crushing deflation comes washing over the U.S. and Europe. Investors panic.
That’s the view of perennial pessimist Albert Edwards. The London-based analyst and his team at investment bank Societe Generale SA have been ranked No. 1 for global strategy in surveys by Thomson Reuters Extel every year since 2007, even with a history of saying unpleasant things that few want to hear.
“My role is to step back from the excessive enthusiasm that builds up in the market, and to just say, ‘This is wrong. This is going to go horribly wrong,’” the 53-year-old said by phone last week.
The Nikkei declined to Short-term support.

The Nikkei declined to test Short-term support at 15659.68 before a brief bounce this week. What this may mean is that devaluing the Yen may no longer play a part in higher stock prices. The influence of the race to the bottom of the Japanese currency had only produced a paltry return…until this week. That may be due to oversaturation producing unintended results. What happens when the Yen reverses?
(ZeroHedge) Define irony. Literally hours after financial entertainment outlet CNBC wrote an article in which it said that "As fourth quarter kicks off, there's one market in Asia that has investors excited: Japan" the Nikkei crashed.
First, some more humor from CNBC, which quotes JPM who apparently does not realize that crushing your currency to generate nominal gains is a zero sum game, and instead of pitching Japan as the next big thing, he should be focusing on the "upside" in Venezuela or Argentina:
US Dollar Index in a Panic Rally.

The US Dollar broke to new highs not seen since June of 2010. I have identified this as a Panic Rally that may peak near mid-October. Panic buying may occur in an index when there is panic selling elsewhere.
(ZeroHedge) With the USD experiencing its longest stretch of weekly gains since Bretton Woods, it appears, as SocGen notes, that recent currency movements have triggered nostalgia of the pre-crisis world when dollar strength was synonymous with a prosperous global economy. However, given the extreme positioning and potential for policy-maker complacency, SocGen warns the paradox is thus that a strong dollar tantrum could be a more worrying scenario than a Fed tightening tantrum.
USB approaches an important Anniversary.

The Long Bond rallied to its mid-Cycle resistance at 138.51 again. In the process of retracement, it formed a probable right shoulder to a Head & Shoulders formation that may give it a “push” to its 33-year-old trendline. Chances are now better-than even of an abrupt decline that may last through October in which USB may break it. The potential target may be weekly Cycle Bottom support at 125.34. The final Master Cycle low may even occur at a much lower level during the week of November 10.
(ZeroHedge) You all remember March 6th, 2009, right? Some days are easier to remember than others and March 6th, 2009 will not easily be forgotten as that was the day when the S&P 500 made its now infamous "666" intraday low and it also marked the closing price low of 683 for the S&P 500 during the financial crisis. Seems like a very long-time ago as the S&P 500 is roughly 1300 points higher than the intraday financial crisis low.
Interestingly, as of the close yesterday, the spread between the 10-year treasury and the 30-year treasury fell to its lowest level (69 bps) since that infamous day.
Since April 2013, the long-end of the yield curve has steadily fallen by 55 basis points.
Gold closes negative for 2014.

Gold hesitated at its Trading Cycle Pivot on Wednesday, then continued lower, closing just above the Lip of its Cup with Handle formation at 1181.40. The trouble is, gold may be in a “panic” to reach its Cycle Bottom support at 1058.64 by next Friday. Will it keep its date?
(Forbes) Good news for the economy is bad news for safe-haven trades, and none more so than gold: The Bureau of Labor Statistics released a stronger-than-expected jobs report Friday morning, revealing that U.S. non-farm payrolls added 248,000 jobs last month and sending the unemployment rate below 6% for the first time since 2008. And while the equity markets cheered the news, gold futures and spot-gold prices have gone negative for the year and tumbled below $1,200 an ounce.
Gold futures (for December delivery) opened for Friday trading at $1,213.20 an ounce and had been trading in the red throughout the early morning, but the BLS’s proclamation that the economy added more jobs than expected led the precious metal to fall even deeper into negative territory. Gold futures are currently trading for $1,193.00 an ounce and spot gold is trading around $1,191.50, giving them daily losses of 1.8% and 1.86%, respectively. In crossing below the $1,200 mark, gold has gone negative for the year.
Crude breaks the neckline.

Crude declined through its Head & Shoulders neckline in a panic selling binge that may last until the week of October 20. The decline may gain momentum as sellers outnumber buyers in a quick-moving decline.
(CNBC) Crude oil has gotten crushed this week, with West Texas Indermediate futures falling below $90 per barrel on Thursday for the first time in more than a year. And though oil has staged a mild comeback over the course of the session, crude oil futures are still 15 percent below the high set in June.
At this point, traders say bearish fundamentals and an awful-looking chart could point to more downside ahead for oil.
China stocks remain glued to the weekly Cycle Top.

The Shanghai Index remains at its Cycle high this week, challenging its Cycle Top at 2360.18. There is no reversal pattern which can be detected. There is a significant Cycle Pivot due on October 13, but no indication of whether it will be a high or a low. Because this Cycle is so exaggerated, the reversal may be even more awe-inspiring than the rally as it declines into its next Cycle low.
(ZeroHedge) China may be doing everything in its power to divert attention from the simple fact that its housing bubble, the largest in the world in terms of both assets comprising it as well as divergence from fair value, has burst. But while there is no clear threshold of what constitutes a bursting bubble when it comes to housing, the latest data out of Soufun, China's largest real-estate website, which said that land sales have dropped a massive 22% to 1.7 trillion Yuan in 2014 so far, is likely as clear an indication as any that Beijing is about to panic.
And if that was not enough Bloomberg adds that land sales in 300 cites followed by SouFun Holdings Limited (NYSE:SFUN) fell almost 50% Y/Y to 415.9 billion yuan in 3Q, while residential land sales declined more than 50% to 265.3b yuan in 3Q.
The Banking Index bounced from Long-term support.

-- BKX declined through the lesser supports to bounce on Long-term support at 69.96. The two-day rally brought it back above all the support levels, but still at a loss from a week ago. A decline to the Broadening Wedge trendline at 68.00 may bring on a panic decline that could last through late October.
(ZeroHedge) Back in June 2011, Zero Hedge first posted:
"Exclusive: The Fed's $600 Billion Stealth Bailout Of Foreign Banks Continues At The Expense Of The Domestic Economy, Or Explaining Where All The QE2 Money Went"
which we followed up on various occasions, most notably with
"How The Fed's Latest QE Is Just Another European Bailout" and
"The Fed's Bailout Of Europe Continues With Record $237 Billion Injected Into Foreign Banks In Past Month."
Fast, or rather slow, forward to today when none other than the WSJ's Jon Hilsenrath debunks yet another "conspiracy theory" and reveals it as "unconspiracy fact" with "Fed Rate Policies Aid Foreign Banks: Lenders Pocket a Spread by Borrowing Cheaply, Parking Funds at Central Bank"
Wait... the Wall Street Journal said that? Yup.
Banks based outside the U.S. have been unlikely beneficiaries of the Federal Reserve's interest-rate policies, and they are likely to keep profiting as the Fed changes the way it controls borrowing costs.
(ZeroHedge) Two months ago, we warned that Deutsche Bank "raised the warning flag", when its strategist Jim Reid, referring to the infamous chart showing the correlation of the Fed's balance sheet and the S&P 500 said:
The risk sell-off we've seen in recent weeks frustrates us a little as the chart we've published most this year has pretty much predicted that tougher times would come around July. We've been paying it a lot of attention for over a year now but decided to wait until the autumn before we raised the warning flags. The chart in question (included in today's pdf) is the one showing the Fed balance sheet and the S&P 500 (as a proxy for risk generally). As you can see, since the Fed balance sheet was used as an aggressive policy tool post-GFC, the graph suggests that the S&P 500 is well correlated with the size of the Fed balance sheet with the former leading the latter by 3 months. Given that the Fed have recently signalled that they will likely be finishing expanding their balance sheet in October, 3 months before that was July. This is important as virtually all of the mega rally in the last 5 years has come in the Fed balance sheet expansion periods. The other periods have been more challenging for markets.
Disclaimer: Nothing in this email should be construed as a personal recommendation to buy, hold or sell short any security. The Practical Investor, LLC (TPI) may provide a status report of certain indexes or their proxies using a proprietary model. At no time shall a reader be justified in inferring that personal investment advice is intended. Investing carries certain risks of losses and leveraged products and futures may be especially volatile. Information provided by TPI is expressed in good faith, but is not guaranteed. A perfect market service does not exist. Long-term success in the market demands recognition that error and uncertainty are a part of any effort to assess the probable outcome of any given investment. Please consult your financial advisor to explain all risks before making any investment decision. It is not possible to invest in any index.