REVIEW
A volatile and somewhat disappointing week for the bulls. The week started off with a gap down on Monday, followed by a tradable low at SPX 1837 on Tuesday. Then after a rally to SPX 1873 at Thursday’s open, the market sold off rapidly into Friday. For the week the SPX/DOW were -2.50%, the NDX/NAZ were -2.85%, and the DJ World index was -2.0%. Economic reports for the week, oddly enough, were all to the upside. On the uptick: consumer credit, wholesale inventories, export/import prices, the PPI, consumer sentiment, the WLEI, the M1-multiplier, plus the budget deficit and weekly jobless claims both improved. Next week we get reports on the FED’s beige book, Industrial production, the NY/Philly FED and Housing.
LONG TERM: Bull market
This week’s market activity put a dent in our more bullish realignment scenario as the SPX/DOW/NDX/NAZ all confirmed downtrends. The realignment would have occurred if the SPX/DOW remained in uptrends, while the NDX/NAZ ended its downtrend. As a result of this week’s activity we have shifted the SPX count to match the DOW count, while our NDX/NAZ count remains unchanged. More on this later.
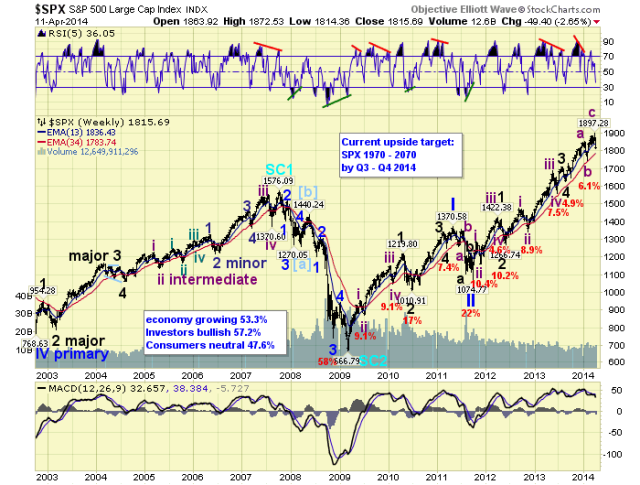
We continue to count this bull market as Cycle wave [1]. Primary waves I and II completed in 2011, and Primary wave III has been underway since then. While only one of Primary I’s five Major waves subdivided, all three rising Major waves of Primary III are subdividing. We have labeled Major waves 1 and 2 completing in mid-2012, and Major waves 3 and 4 completing in mid-2013. Major wave 5 has been underway since that low.
When Major wave 5 does conclude, it will end Primary III. Then we should see the largest correction since 2012 for Primary IV. After that Primary V should carry the market to new all time highs. Currently our bull market target is SPX 1970-2070 by Q3 2014.
MEDIUM TERM: Downtrend
After an uptrend high in January, which we labeled Int. wave one, and a downtrend low in February. We expected the recent uptrend to be Int. wave three. This week, however, a new downtrend was confirmed ending what appears to be a three wave February to April uptrend. This uptrend aborted quite a bit below expectations, and it can not possibly be a wave three, as it has already overlapped the high of the previous uptrend. As a result of this market activity we have aligned the SPX count with the DOW count.

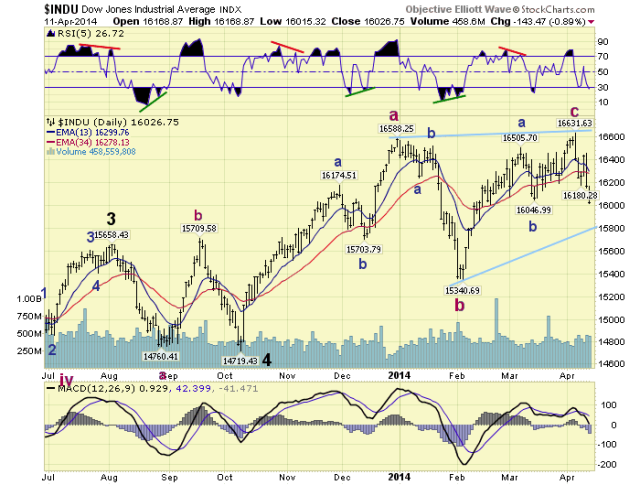
We have been counting the DOW as a potential Major wave 5 diagonal triangle. This pattern is considered a rising wedge a-b-c-d-e pattern that unfolds in higher highs and higher lows. But all uptrends are overlapped by the next downtrend. Under this scenario the NDX/NAZ can continue to complete their Primary III normally, while the SPX/DOW make marginal new highs in their Primary III. Then they will likely all realign again for Primary wave IV.
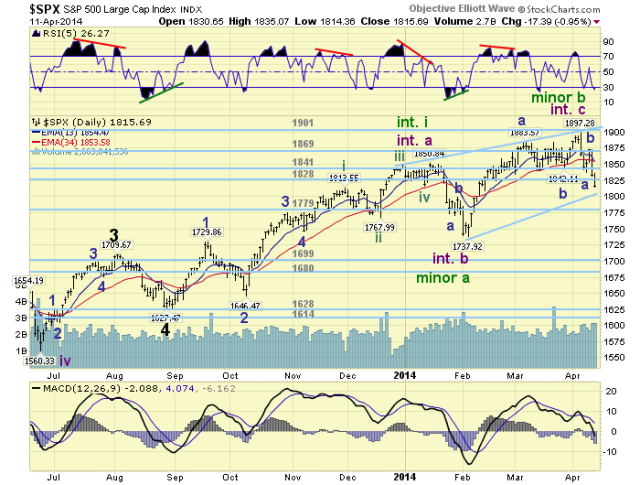
When reviewing the SPX chart under this scenario we observed Int. wave A topped in January, then had a 50% retracement for Int. wave B. With the recent uptrend, Int. C, topping in April another 50% retracement would find support around SPX 1814. If the retracement extends to 61.8%, which is acceptable in this pattern, the SPX should find support around 1800. If this level does not hold, and the downtrend creates more of a channel than a rising wedge. Then our alternate count, in green on the daily chart, would suggest a retest of SPX 1738. We are likely to find out which count is in play this week. Medium term support is at the SPX 1779 and 1699 pivots, with resistance at the 1828 and 1841 pivots.
SHORT TERM
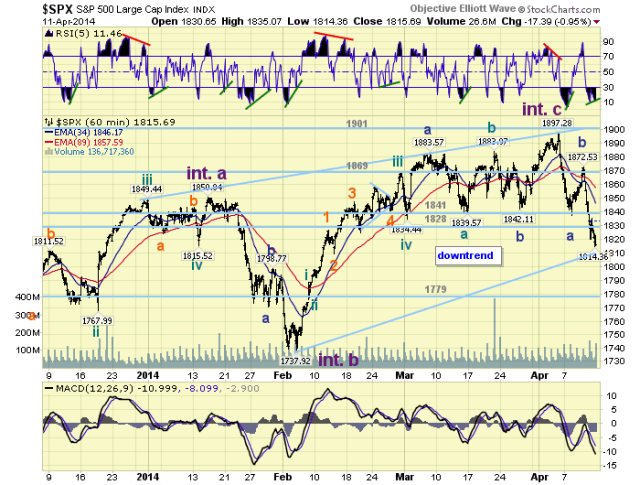
Short term support is at SPX 1814, SPX 1800, with resistance at the 1828 and 1841 pivots. Short term momentum ended the week oversold, with a positive divergence. The short term OEW charts remain negative from SPX 1860, with the reversal level now 1846.
The February to April uptrend appears to have ended with three Minor waves: 1884-1842-1897. The downtrend from that high also appears to be unfolding in three Minor waves: 1837-1873-1814 thus far. When we reviewed the January to February downtrend we observed it had also declined in Minor three waves: 1770-1799-1738. This is typical wave activity in a diagonal triangle.

The a-b-c January to February downtrend unfolded as a 5-3-5 zigzag. Minor A was five waves down, Minor B a strong rally, then Minor C five waves down, in total: 80-30-60 points. This downtrend, from the April high, has already completed five waves down for Minor A, Minor B was a strong rally, Minor C appears in the process of doing five waves down, in total 60-35-60 points so far. Notice these two downtrends are thus far quite similar. If this Minor wave C ends with a small diagonal triangle it could bottom around SPX 1814. If it divides into five clean waves then SPX 1800 could provide support. Thus far we can count four waves down from the SPX 1873 Minor B wave high: 1820-1835-1814-1823. A diagonal triangle Minor C could be forming. If the market continues to fall to the 1779 pivot, then a retest of SPX 1738 is likely.

